REDCap tutorials
| Site: | Moodle UniFR |
| Course: | DIT-ER Help |
| Book: | REDCap tutorials |
| Printed by: | Guest user |
| Date: | Wednesday, 17 June 2026, 12:35 AM |
Description
This book contains tutorials related to complex functionalities from REDCap as well as a list of new functionalities that are introduced at each major update.
Of note, if in REDCap you are not seeing one of the functionalities presented in the book, it means that you do not have the access rights. To access the desired functionality, go to  , select your username and click on
  to adjust the individual access privileges. If you are not even seeing the option, then you need to ask the project responsible or the Sponsor/PI to grant you access to the desired functionality.
Recording of the last REDCap Database Implementation Course [16.10.2025]
The course material can be downloaded here.
REDCap Updates
In this chapter you will find a brief summary of the new features introduced with each significant update of our REDCap installations.
REDCap major updates
REDCap 13.1.13 LTS
The most relevant changes are highlighted in red.
| Category | Description | Introduced |
|---|---|---|
| Fields | Select and modify multiple fields together on the Online Designer: Users may select multiple fields on the Online Designer by holding the Ctrl, Shift, or Cmd key on their keyboard while clicking on the field in the table, which will reveal the options to Move, Copy, or Delete all the selected fields. To make users aware of this feature, a floating note now appears near the right side of the page in the Online Designer with instructions on how to use this. | 10.1.1 |
| Survey | New hook: redcap_survey_acknowledgement_page: Allows custom actions to be performed on a survey's acknowledgement/"thank you" page immediately after the survey has been completed. Note: This hook is different from the redcap_survey_complete hook because the redcap_survey_complete hook is not recommended if you wish to output HTML, CSS, or JS onto the survey page after the survey is completed (because the page may be redirected immediately after the survey is completed, thus the participant might never see anything output by this hook prior to the redirect). The redcap_survey_acknowledgement_page hook is recommended for outputting HTML, CSS, or JS onto the survey page after the survey is completed. | 10.2.0 |
| Alerts | Users may re-evaluate some or all Alerts & Notifications for all records in a project. If an alert has been modified after data has already been entered in the project, users may click the “Re-evaluate Alerts” button on the Alerts & Notifications page, which will re-evaluate selected alerts for all records to ensure that notifications get properly sent or scheduled based on the new conditions of the alert (otherwise they could only be triggered if each individual record had data modified). If a user modifies the conditional logic of an alert, it will recommend that they utilize the “Re-evaluate Alerts” functionality. If an alert has the “Ensure logic is still true…” option checked, then it is possible during this process that some already-scheduled notifications might get removed (and thus would no longer be scheduled) based on the new conditions. | 10.3.0 |
| Survey | Users may re-evaluate some or all Automated Survey Invitations for all records in a project. If an ASI has been modified after data has already been entered in the project, users may click the “Re-evaluate Auto Invitations” button in the Online Designer, which will re-evaluate selected ASIs for all records to ensure that invitations get properly sent or scheduled based on the new conditions of the ASI (otherwise they could only be triggered if each individual record had data modified). If a user modifies the conditional logic of an ASI, it will recommend that they utilize the “Re-evaluate Auto Invitations” functionality. If an ASI has the “Ensure logic is still true…” option checked, then it is possible during this process that some already-scheduled invitations might get removed (and thus would no longer be scheduled) based on the new conditions. | 10.3.0 |
| Survey | Added "Language of text to be spoken" for the "Text-To-Speech" survey functionality, which is available on the Survey Settings page. For several years, REDCap has had a Text-to-Speech feature for surveys that, when enabled, allows questions and other text on survey pages to be converted into natural-sounding audio for the participant to hear. Up until now, it supported English only, but now REDCap users may utilize the Text-to-Speech feature in a variety of non-English languages and voices, assuming that the survey text is in a non-English language. This includes Arabic, Brazilian Portuguese, English (UK and US), French, German, Italian, Japanese, and Spanish (Castilian, Latin American, and North American). | 10.3.0 |
| Data Quality | Data Quality Rule import/export - The Data Quality page in a project now displays a drop-down list of options for users to import/export custom Data Quality rules via a CSV file. Note: This does not apply to the pre-defined DQ rules (rules A-I). Also, when DQ rules are imported, the process is additive only, meaning that the CSV upload cannot replace or edit existing DQ rules but will only add new ones to the project. | 10.4.0 |
| DAG | Data Access Group import/export and DAG-User assignment import/export: The Data Access Groups page in a project now displays a drop-down list of options for users to import/export Data Access Groups, which allows users to bulk create or rename DAGs via a CSV file. It also allows for the import/export of DAG-user assignments via CSV file to bulk assign/reassign/unassign users from DAGs in a project. Note: The DAG-user assignment import affects only a user’s *current* DAG assignment; thus, it has no effect on the DAG Switcher assignments for the user. | 10.4.0 |
| Action Tags | @CALCDATE: Performs a date calculation by adding or subtracting a specified amount of time from a specified date or datetime field and then provides the result as a date or datetime value - e.g., @CALCDATE([visit_date], 7, 'd'). The first parameter inside the @CALCDATE() function should be a text field with date, datetime, or datetime_seconds validation, in which you may specify (if needed) the event and repeating instance - e.g., @CALCDATE([baseline_event][visit_date], 7, 'd'). The second parameter represents the offset number amount that should be added or subtracted. It can be a decimal number or integer. Tip: To subtract (i.e., go backwards in time), use a negative number. The third parameter represents the units of the offset amount, which will be represented by the following options: 'y' (years, 1 year = 365.2425 days), 'M' (months, 1 month = 30.44 days), 'd' (days), 'h' (hours), 'm' (minutes), 's' (seconds). The unit option must be wrapped in quotes or apostrophes. @CALCTEXT - Evaluates logic that is provided inside a @CALCTEXT() function and outputs the result as text, typically performed with an if(x,y,z) function - e.g., @CALCTEXT(if([gender]='1', 'male', 'female')). NOTE: It is important to realize that a field with @CALCTEXT will not be editable on the survey page or data entry form, and the field will function almost exactly like a normal calculated field, in which its value may get updated via a data import, when running Data Quality rule H, or in real-time during normal data entry on a form or survey. If desired, it is possible to return the value as a number - e.g., @CALCTEXT(if([age] >= 18, 'adult', 5*[other_field])). |
10.4.0 |
| Survey | New survey option “Save a PDF of completed survey response to a File Upload field”: On the Survey Settings page in the Online Designer, users may select a File Upload field in the project where a static PDF file of a participant’s survey response will be stored immediately after they complete the survey. For longitudinal projects, if the target field exists on multiple events, users may set this feature so that it stores the PDF in the selected field in the current event (default) or else in a specific event in the project. Thanks to Philip Chase and his team at University of Florida for their inspiration for this feature, in which it was based on their “Save Survey PDF to Field” external module. NOTE: Upgrading to REDCap 10.6.0 will *not* automatically disable the “Save Survey PDF to Field” module if it is installed and enabled on any projects, nor will it transfer the saved settings of that module into this new feature in REDCap | 10.6.0 |
| Imports | Auto-numbering of repeating instances for data imports: When using repeating events or repeating instruments, it may be difficult when performing dynamic imports of data for these because it is not easily known how many repeating instances already exist in a project for a given repeating event/instrument, thus often forcing users to invent clever ways to determine this, such as performing data exports beforehand and then dynamically determining what the next repeating instance number should be. However, that is no longer necessary. When performing a data import now for a repeating event/instrument, users may use the literal value “new” as the value for the “redcap_repeat_instance” field in their data import. By doing so, REDCap will perform the instance auto-numbering on its own to increment the repeating instances properly based on the highest numbered instance that already exists in the saved data in the project. | 10.6.0 |
| Logic | New logic editor for conditional logic, branching logic, calculations, report filters, etc.: In every place where users might add/edit logic or calculations, the new logic editor will be displayed in a modal dialog to provide a better user experience for entering their logic. The logic editor provides much more space for entering large amounts of logic, including a fullscreen mode to take maximum advantage of their screen’s real estate. It also provides bracket-matching and parentheses-matching where it will highlight a pair of matching brackets/parentheses to make it easier for users to gauge which brackets/parentheses belong together in the logic, thus reducing possible errors in the logic when typing. | 10.6.0 |
| Piping | New “:inline” piping option for File Upload fields: If piping using the ':inline' option for a File Upload field, such as [my_field:inline], in which the uploaded file is a PDF file or image file (JPG, JPEG, GIF, PNG, TIF, BMP), the file will be displayed in an inline manner so that it is viewable on the page. The ':inline' option DOES work inside emails, so you can pipe a field with ':inline' inside the email body, thus allowing you to display inline images inside survey invitations or Alerts & Notifications. | 10.7.0 |
| Action Tags | @INLINE action tag: Allows a PDF file or image file (JPG, JPEG, GIF, PNG, TIF, BMP) that is uploaded to a File Upload field to be displayed in an inline manner on the survey page or data entry form so that the PDF/image can be viewed by the user or survey participant without having to download it. | 10.7.0 |
| Fields | Field Bank: When adding new fields via the Online Designer, users will see an "Import from Field Bank" button, which will allow them to search different standardized catalogs of commonly used fields, such as in the U.S. National Library of Medicine catalog. The Field Bank helps users add new fields quickly and easily to their data collection instruments. Over time, more standardized catalogs of fields will be added to the Field Bank. | 10.7.0 |
| Piping | New “:link” piping option for File Upload fields: If piping using the ':link’ option for a File Upload field, such as [my_field:link], the file's filename will be displayed as a clickable hyperlink for downloading the file, which works on webpages and also inside the body of email text (i.e., survey invitations or Alerts & Notifications). | 10.7.1 |
| User Rights | Ability to to import/export user rights via a CSV file on the User Rights page: Users can download a CSV file to view all the user privileges of the existing users in a project, including their instrument-level user rights. Users can upload a CSV file to grant new users access to the project and/or to modify the user privileges of existing users, including their instrument-level user rights. | 10.8.0 |
| API | New API “Export Logging” method: This new API method allows users to export a project’s logging via the API using very similar methods and filters as in the project’s user interface. See the documentation for all filter parameters that are available. | 10.8.0 |
| Range | Custom ranges (min/max) for slider fields - Users may now set a custom minimum and/or custom maximum integer value for slider fields. The default min and max is still 0 and 100, respectively. If no value is entered for the min or max value, it will assume the default value. These can be set via the Edit Field popup in the Online Designer, and via the “Text Validation Min” and “Text Validation Max” columns in the Data Dictionary. | 10.8.0 |
| Data Quality | Export Data Quality rule results - After running a data quality rule, users may export the results/discrepancies of the rule as a CSV file. The CSV file will be structured exactly like a date export/import file, which should allow for faster and easier cleaning of data so that values can be fixed and then re-uploaded as a data import. | 10.8.4 |
| Survey | Alternative survey completion text: Users can optionally set alternative survey completion text that is displayed in place of their standard survey completion text whenever a survey is ended via a Stop Action on any field. This is useful when it doesn’t make sense for non-eligible participants to see the same survey completion text as those who completed the survey fully. Prevent survey responses from being saved if the survey ends via Stop Action: Users can optionally choose to prevent submitted responses from being saved as data in the project if the survey ends via Stop Action. This is useful if survey administrators do not wish to keep the data for ineligible participants, for example. This means that if a one-page public survey is started but ends via Stop Action, no data from that response will be saved into the project (i.e., no new record will be created), but it will log this event on the project Logging page (so that users are at least aware of this happening despite no data being saved). |
10.9.0 |
| Survey | Custom offline message for surveys in offline status- Users can provide custom text that is displayed to participants only when the survey is offline. This custom text will be displayed in place of the default offline text on the survey while the survey is in offline mode. This text can be set at the top of the Survey Settings page. | 10.9.0 |
| Charts | Smart Charts: Smart Charts are various aggregate plots and charts utilized as different Smart Variables. The following plots are available for use: bar charts, pie charts, donut charts, scatter plots, and line charts. These are all represented by the following Smart Variables, respectively: [bar-chart], [pie-chart], [donut-chart], [scatter-plot], and [line-chart]. These Smart Variables accept one or more field names and also other optional parameters, as described below for each. | 11.0.0 |
| Tables | Smart Tables: Smart Tables are tables displaying aggregate descriptive statistics in which the results of any or all of the following stats functions can be displayed for one or more fields: minimum, maximum, mean/average, media, sum, count, standard deviation, count of missing values, and count of unique values. Smart Tables are represented with the Smart Variable [stats-table], which accepts as a parameter the variable names (comma delimited) of all the fields to be displayed as separate rows in the table. There is no limit to the number of fields that can be used. For example, [stats-table:field1,field2,field3]. | 11.0.0 |
| Functions | Smart Functions: Smart Functions are aggregate mathematical functions that are utilized as Smart Variables. The following Smart Functions exist: [aggregate-min], [aggregate-max], [aggregate-mean], [aggregate-median], [aggregate-sum], [aggregate-count], [aggregate-stdev], and [aggregate-unique]. Each represents the mathematical functions minimum, maximum, mean/average, media, sum, count, standard deviation, and unique count, respectively. Each must have at least one field attached to it that follows a colon - e.g., [aggregate-mean:age]. Multiple fields may be used in each one, which will perform the function over all the data values of all the fields. By default, the functions will utilize all data values for all records in the project. To limit the data values being utilized to a subset of the total project data, see the Smart Variable documentation on how to apply filters, such as attached unique report names, DAGs, and other parameters | 11.0.0 |
| Projects | Project Dashboards: Project Dashboards are pages with dynamic content that can be added to a project. They can utilize special Smart Variables called Smart Functions, Smart Tables, and Smart Charts (described below) that can perform aggregate mathematical functions, display tables of descriptive statistics, and render various types of charts, respectively. User access privileges are customizable for each dashboard, and anyone with Project Design privileges can create and edit them. A Wizard is provided on the Project Dashboard creation page to help users easily construct the syntax for Smart Functions, Smart Tables, or Smart Charts, and a basic list of helpful examples is also included. Example dashboard: https://redcap.link/dash1 | 11.0.0 |
| Alerts | Reorder alerts on Alerts & Notifications page - In the options menu for any given alert, a user can select an alert to be moved to another position on the Alerts & Notifications page. When this is done, it notifies the user that moving the alert will in most cases cause the alert numbers to be renumbered for many existing alerts (since they are numbered based on their order). However, their alert title and unique alert ID will not change during this process. | 11.1.0 |
| Alerts | Import/export alerts via CSV file on Alerts & Notifications page: Users may export and import alerts to the same project or another project using a CSV file. If updating an existing alert, the unique alert ID must be included in the CSV file to identify the alert that the user wishes to modify. If the unique alert ID is left blank in the CSV file being uploaded, it is assumed that the user wishes to create a new alert. | 11.1.0 |
| Branching Logic | Project-level setting “Prevent branching logic from hiding fields that have values”: This setting can be enabled by any project user with Project Setup/Design privileges in the Additional Customizations popup on the Project Setup page This setting affects both data entry forms and surveys. If it is not enabled (default), then whenever a field is to be hidden by branching logic on a data entry form, it will always ask the user if they wish to hide the field and erase its value, whereas on survey pages it will automatically erase the value of the field being hidden without displaying the confirmation prompt, which has always been the default behavior for surveys. If this setting is enabled, the branching logic behavior will change so that fields with values will not cause the 'Erase the Value of the Field?' confirmation prompt to ask the user if they wish to keep the value or hide the field, and instead fields with values will not be hidden by branching logic and will stay visible. Thus they will be exempt from branching logic. This will prevent data from being erased as it normally does if fields are hidden by branching logic. | 11.2.0 |
| API | Tableau Data Export- Extract all records into Tableau via the REDCap API. This feature enables Tableau (v10.0+) users to connect Tableau to a REDCap project using an API token. Project data can be exported on demand and be available for use within Tableau to produce summaries and visualizations. The Other Export Option page in any given project has instructions to export project data into Tableau. | 11.2.0 |
| Action Tags | @MAXCHOICE-SURVEY-COMPLETE: Similar to @MAXCHOICE but only counts choices on completed survey responses (does not count data entered as data entry only or on partial responses). Causes one or more specified choices to be disabled (i.e., displayed but not usable) for a checkbox, radio button, or drop-down field after a specified amount of records have been saved with that choice for completed survey responses only. | 11.2.0 |
| Smart Variables |
|
11.2.0 |
| Reports | Ability to make reports accessible at a public link: When editing a report, users can now set a report as “public” and can obtain a public link to the report if they have User Rights privileges in the project. When a report is public, this means that all data in the report will be fully accessible (with no authentication required) to anyone with the public link to the report. | 11.2.0 |
| DAG | “DAG Switcher” API method: When using the DAG Switcher functionality in a project, this method allows users to move themselves in and out of a Data Access Group at will using the API just as they would do the same thing in the user interface (assuming they have been assigned to multiple DAGs on the DAG Switcher page). | 11.3.1 |
| Action Tags | @IF: Allows various action tags to be set based on conditional logic provided inside an @IF() function - e.g., @IF(CONDITION, ACTION TAGS if condition is TRUE, ACTION TAGS if condition is FALSE). Simply provide a condition using normal logic syntax (similar to branching logic), and it will implement one set of action tags or another based on whether that condition is true or false. For example, you can have @IF([yes_no] = '1', @HIDDEN, @HIDE-CHOICE='3' @READ-ONLY), in which it will implement @HIDDEN if the 'yes_no' field's value is '1', otherwise, it will implement the two action tags @HIDE-CHOICE='3' and @READ-ONLY. If you wish not to output any action tags for a certain condition, set it with a pair of apostrophes/quotes as a placeholder - e.g., @IF([my_radio]='1', @READONLY, ''). You may have multiple instances of @IF for a single field. You may also have multiple nested instances of @IF() inside each other. Both field variables and Smart Variables may be used inside the @IF condition. The @IF action tag is also evaluated for a given field when downloading the PDF of an instrument/survey, in case there are any PDF-specific action tags used inside of @IF(). | 11.4.0 |
| Email Logging page: This is a new project page that contains a search interface to allow users with User Rights privileges to search and view ALL outgoing emails for that project (also includes searching and viewing of SMS messages if using Twilio services). | 11.4.0 | |
| Protected Email Mode: Users can enable the Protected Email Mode on any project on the Project Setup via the Additional Customization dialog. This setting prevents identifying data (PHI/PII) from being sent in outgoing emails for alerts, survey invitations, and survey confirmation emails. If enabled, either A) all alerts, survey invitations, and survey confirmation emails or B) those whose email body is attempting to pipe data from Identifier fields will be affected, in which it will not send the full email text to the recipient but will instead send a surrogate email containing a link that leads them to a secure REDCap page to view their original email. If someone is accessing an email in the Protected Email Mode for the first time (or for the first time in the past 30 days), it will send a security code to their inbox that will allow the recipient to view any protected emails for up to 30 days on that same device. The Protected Email Mode is similar to Microsoft Outlook's "sensitivity label" feature. | 11.4.0 | |
| MLM | Multi-Language Management: Users can create and configure multiple display languages for their projects for surveys, data entry forms, alerts, survey invitations, etc. Users can design data collection instruments and have them be displayed in any language that they have defined and translated so that their survey participants or data entry persons can view the text in their preferred language. This eliminates the need to create multiple instruments or projects to handle multiple languages. NOTE: The MLM feature will not auto-translate text, but provides tools so that users may easily translate them themselves. | 12.0.0 |
| MLM | New Action Tags for Multi-Language Management:
|
12.0.0 |
| Forms | Form Display Logic: Form Display Logic is an advanced feature that provides a way to use conditional logic to disable specific data entry forms that are displayed on the Record Status Dashboard, Record Home Page, or the form list on the left-hand menu. You might think of it as 'form-level branching logic'. Form Display Logic can be very useful if you wish to prevent users from entering data on a specific form or event until certain conditions have been met. The forms will still be displayed on the page, but they will be disabled in order to prevent users from accessing them. Below you may define as many conditions as you want. A form may be selected in multiple conditions, but if so, please note that the form will be enabled if at least one of the conditions is met. The Form Display Logic does not impact data imports but only operates in the data entry user interface to enable/disable forms. Additionally, Form Display Logic is not utilized by the Survey Queue at all but can affect the behavior of the Survey Auto-Continue feature if the checkbox for it is enabled in the setup dialog. The Form Display Logic setup can be found by clicking the “Form Display Logic” button at the top of the instrument list in the Online Designer. | 12.0.0 |
| Check | Design Checker for the Clinical Data Mart (CDM): The “Data Mart Design Checker” is a new tool available in the Data Mart fetch page that will report any issue related to the design of the current Data Mart project. Based on the most recent Data Mart XML template available in REDCap, the tool will check, list, and fix any of these issues: missing forms, variables, revisions, or section headers, the lack/presence of repeatability in a form, variables included in the wrong form, etc. An administrator or a user with Project Setup/Design privileges can use the tool to review and automatically fix all reported issues. This tool will mainly be utilized when users have modified the structure of an existing Data Mart project or if new forms and data types have been added to the Data Mart feature itself since the users initially created their Data Mart project. | 12.0.0 |
| Smart Variable | [event-number]: The current event's ordinal number as listed on the Define My Events page that denotes the order of the event within a given arm. | 12.0.5 |
| Field Validation | Time (HH:MM:SS): This new time-based field validation (unique name "time_hh_mm_ss") will be added automatically and enabled by default during the upgrade process. This validation forces users/participants to enter a time value that contains the hour, minute, and second components. It also includes the usage of the "Now" button and the timepicker popup widget, both of which are displayed next to the field on the survey page or data entry form. Note: Fields with this field validation can be utilized inside the datediff() function. (Thanks to the Field Validation Committee for this addition.) |
12.1.0 |
| Action Tags | @FORCE-MINMAX: The action tag @FORCE-MINMAX can be used on Textbox fields that have a min or max validation range defined so that no one will not be able to enter a value into the field unless it is within the field's specified validation range. This is different from the default behavior in which out-of-range values are permissible. Note: @FORCE-MINMAX is also enforced for data imports to ensure the value is always within the specified range. |
12.1.0 |
| Range | Dynamic min/max range limits for fields: Instead of using exact values as the minimum or maximum range of Textbox fields (e.g., "2021-12-07"), you may now also use "today" and "now" as the min or max so that the current date or time is always used. These can be used to prevent a date/time field from having a value in the past or in the future. Additionally, you can now pipe a value from another field into the field's min or max range setting - e.g., [visit_date] or [event_1_arm_1][age]. This can help ensure that a Textbox field (whether a date, time, or number) has a larger or smaller value than another field, regardless of whether the field is on the same instrument or not. | 12.1.0 |
| Survey | Conditional logic for Survey Auto-Continue: When enabling Survey Auto-Continue on the Survey Settings page for a survey, users may now optionally specify conditional logic to determine whether or not the auto-continue should be applied. As such, REDCap will auto-continue to the next survey *only* if the conditional logic is TRUE or if the logic textbox has been left blank. This new option can be used as a simpler alternative to the Survey Queue, which can require more complex instrument-event level configurations for longitudinal projects. | 12.1.0 |
| Smart Variables | New Smart Variables for Survey Start Date/Time: Users can access the start time via piping by using the new Smart Variables [survey-time-started:instrument] and [survey-date-started:instrument], which can be used inside the @DEFAULT or @CALCTEXT action tags, among other places. If users wish to have them return the raw value, which will be in 'YYYY-MM-DD HH:MM:SS' format and would be more appropriate for conditional logic or calculated fields, simply append ':value' after the unique instrument name - e.g., [survey-date-started:instrument:value]. New Smart Variables for Survey Duration: Users can obtain the total amount of time that has elapsed since the survey was started (in seconds, minutes, etc.) by using [survey-duration:instrument:units] and [survey-duration-completed:instrument:units]. The Smart Variable [survey-duration] represents the difference between the survey's start time and either its 1) completion time (if completed) or 2) the current time (if not completed), whereas [survey-duration-completed] represents the difference between the survey's start time and completion time, in which a blank value will be returned if the survey has not been completed. Options for 'units': 'y' (years, 1 year = 365.2425 days), 'M' (months, 1 month = 30.44 days), 'd' (days), 'h' (hours), 'm' (minutes), 's' (seconds). |
12.2.0 |
| User Rights | Instrument-level Data Export Rights: Users may specify instrument-level privileges regarding a user's data export capabilities on the User Rights page in a project. A user may be given "No Access", "De-Identified", "Remove All Identifier Fields", or "Full Data Set" data export rights for EACH data collection instrument. This improvement will make it much easier to match a user's Data Exports Rights with their Data Viewing Rights, if you wish, and will give users more granular control regarding what data a user can export from your project. | 12.2.0 |
| Survey | Save a PDF of completed survey response to a File Upload field: users can now optionally set this feature to store the translated version of the PDF if the Multi-language Management feature is being utilized for the survey. This can be enabled by checking the “Store the translated version of the PDF” checkbox below the “Save a PDF…” setting on the Survey Settings page for the desired survey. | 12.2.2 |
| Piping - Action Tags |
@PLACEHOLDER: Piping can now be performed inside the value of the @PLACEHOLDER action tag - e.g., @PLACEHOLDER="[first_name] [last_name]". | 12.2.3 |
| Survey | Survey UI Tweaks: Integration of many features from the “Survey UI Tweaks” External Module. The Survey UI Tweaks EM will not be disabled for any projects. | 12.3.0 |
| Alerts | SendGrid Dynamic Templates for Alerts & Notifications: SendGrid Dynamic Templates give users significantly more control over the style and design of emails when compared to the standard email alert type. Enabling this feature on the Project Setup page will give users another alert type to choose from on the Alerts & Notifications page called “SendGrid Template”. Thus, similar to Twilio, this feature is a project-level feature that users may enable on individual projects (or users can have administrators enable it for them). This integration requires that you have an account setup on sendgrid.com. | 12.4.0 |
| Calendar | Calendar Sync: Users may sync their REDCap project calendar or perform a one-time import of their project calendar events to external calendar applications such as Google Calendar, Outlook, Office 365, Zoho, Apple Calendar, or any application that supports iCal or ICS files. They may choose one of the two options below to sync or import their project calendar events to an external calendar application. | 12.4.0 |
| Images | Embedding images in text & emails: Users may now embed one or more inline images into the text of a survey invitation, an alert, or a field label on a form/survey, among other things, by clicking the image icon in the rich text editor and then by uploading an image from their local device. Anywhere that the rich text editor is used, users may embed an image into its text (with one exception: the @RICHTEXT action tag on public surveys). | 12.5.0 |
| Smart variable | [new-instance]: This new Smart Variable [new-instance] can be appended to [survey-link], [survey-url], [form-link], and [form-url] to create a URL that points to a new, not-yet-created repeating instance for the current record. In this way, [new-instance] functions essentially as [last-instance]+1. This new Smart Variable works for repeating instruments and also for instruments on repeating events. | 12.5.0 |
| Survey | Repeating Automated Survey Invitations (ASIs): Users can now set ASIs to send multiple times on a recurring basis for any repeating survey in a project. If the survey is a repeating instrument or if it exists on a repeating event, then users will see a new section "How many times to send it" in the ASI setup popup in the Online Designer. There users may set the ASI to send survey invitations repeatedly at a regular interval, in which it can repeat forever or a set number of times. This new repeating ASI feature works similarly to how recurring alerts have always worked for Alerts & Notifications. | 12.5.0 |
| Alerts | SendGrid Template Advanced Settings for Alerts & Notifications: A new “advanced settings” section was added to the Alerts & Notifications interface when building an alert using the relatively new SendGrid Template alert type that gives users more control over the underlying SendGrid API call being made when REDCap triggers a SendGrid Template alert. Note that all of the advanced settings are optional, and they are all disabled by default. If “SendGrid Template email services for Alerts & Notifications” are enabled for a project on the Project Setup page, then these advanced settings will appear in the alert creation dialog after selecting “SendGrid Template” as the alert type. The new advanced settings are all listed in detail below. | 12.5.6 |
| Report | Download all files on a report: When viewing a report (including public reports) that contains one or more File Upload fields or Signature fields, a “Download Files (zip)” button will appear on the page to allow users to easily download all the report’s uploaded files into a single zip file for those fields for the records in the report. | 12.5.11 |
| Apps | Integration of the MyCap External Module: MyCap is a participant-facing mobile application (on iOS and Android) used for data collection and the automated administration of active tasks (activities performed by participants using mobile device sensors under semi-controlled conditions). All data collected in the MyCap app is automatically sent back to the REDCap server as soon as internet connection is available (i.e., it can also be used for offline participant data collection). MyCap is a no-code solution for research teams conducting longitudinally-designed projects or projects with frequent participant contact. MyCap also facilitates participant engagement and retention by providing quick access to project staff and two-way communications (e.g., messaging and announcements) within the app. MyCap is available on any iOS device (iOS v11.0+) and any Android device (Android v8.0+). For more information about MyCap, check out the MyCap website, publication, resources, and a list of MyCap use cases. | 13.0.0 |
| File Upload | Redesign of the File Repository: The File Repository page has been redesigned to make it easier to store, organize, and share the files in your projects.Users now have the ability to create folders and sub-folders to help organize their files more effectively. If using Data Access Groups or user roles, users may optionally limit access to a new folder so that it is DAG-restricted and/or role-restricted. Uploading multiple files is much faster with a new drag-n-drop feature that allows for uploading dozens of files at a time. Sharing files is better too, in which users may obtain a public link to conveniently share a file with someone. New API methods also exist that allow users to upload, download, and delete files programmatically using the API. Additionally, the File Repository has a new built-in Recycle Bin folder that makes it easy to restore files that have been deleted. Users can upload as many files as they wish. There is no limit. Additionally, there is no limit to how many folders and sub-folders that can be created (or how deep that they can be nested within other folders). | 13.1.0 |
| File Upload | Embedding file attachments in text & emails: Users may now attach one or more files into the text of a survey invitation, an alert, or a field label on a form/survey, among other things, by clicking the file attachment (paperclip) icon in the rich text editor and then by uploading a file from their local device. This feature is available for every rich text editor *with the exception* of non-project pages (e.g., the Email Users page) and also any field with the @RICHTEXT action tag. | 13.3.0 |
REDCap 13.7.6 LTS
The most relevant changes are highlighted in red.
| Category | Description | Introduced |
|---|---|---|
| Fields | A new "preformatted code block" button was added to the toolbar of all rich text editors. | 13.3.0 |
| Fields & Emails | Embedding file attachments in text & emails: Users may now attach one or more files into the text of a survey invitation, an alert, or a field label on a form/survey, among other things, by clicking the file attachment (paperclip) icon in the rich text editor and then by uploading a file from their local device. All files uploaded via the rich text editor will be represented in the text of the editor as a public file-sharing link, which allows the file to be downloaded in any context (e.g., on surveys, on authenticated REDCap pages, and in public areas like emails and public dashboards). This means that if anyone has possession of this link, they will be able to download the file (at least, until the file has been deleted). All files uploaded via the rich text editor will be automatically stored in a special “Miscellaneous File Attachments” folder in the File Repository where they can be accessed and/or deleted, if necessary. If any such file is deleted from the “Miscellaneous File Attachments” folder in the File Repository, the associated download link for the file will cease to be active and thus will become a dead link wherever it has been used. | 13.3.0 |
| Interface | The Internet Explorer web browser is no longer supported in REDCap | 13.4.0 |
| Alerts | Mosio SMS Services: REDCap has the capability to send SMS text messages for surveys and for Alerts & Notifications by using a third-party web service named Mosio (www.mosio.com). In this way, users can invite a participant to take a survey by sending them an SMS message, in which the data would be collected in REDCap directly from their phone without having to use a webpage. There are two ways REDCap currently works with Mosio: 1) Surveys – Sending survey invitations and also sending questions and getting replies via text message, and 2) Alerts - Sending one-way Alerts & Notifications via text message. The Mosio Two-Way Text Messaging (SMS) Services work exactly the same as the current Twilio functionality, with the exception of the Voice Call features. Mosio can only send and receive SMS messages. For more information and to get a Mosio account, visit https://www.mosio.com/redcap. | 13.4.0 |
| Action Tags | @INLINE-PREVIEW action tag: When this action tag is added to File Upload fields or Description Text fields, a preview button will be displayed next to the field on survey pages and data entry forms if the uploaded file is an image or PDF file. Clicking the preview button will immediately display the image/PDF inline on the page, after which it can be closed again, if desired. This allows users/participants to view the file without having to download it to their local device. | 13.5.0 |
| MLM |
New Multi-Language Management workflow for adding new languages to projects, plus many other improvements:
|
13.7.0 |
REDCap 14.0.10 LTS
The most relevant changes are highlighted in red.
| Category | Description | Introduced |
|---|---|---|
| Data Import | Background Data Import: Users may now alternatively import data using an asynchronous background process (as opposed to the existing real-time process). The background process is better for large data files. The background process will email the user after the data file has been fully imported, and the email will note any errors that may have occurred during the import process. | 13.8.0 |
| Action Tags | @MC-PARTICIPANT-JOINDATE: This action tag is a MyCap annotation that can be used with Text fields with date/time validation. When using this action tag on a field, the field will capture the install date/time of the MyCap participant whenever the participant joins a project via the MyCap mobile app. | 13.8.5 |
| Functions |
|
13.9.0 |
| Action Tags | @MC-PARTICIPANT-CODE: This action tag is a MyCap annotation that can be used with Text fields. When using this action tag on a field, the field will capture the MyCap participant’s participant code whenever they join a project via the MyCap mobile app. | 13.9.3 |
| MyCap | Longitudinal functionality for MyCap-enabled projects: In previous versions, longitudinal projects could not utilize MyCap (the feature would be disabled automatically). Now with the release of the new MyCap mobile apps on Android and iOS, longitudinal functionality is possible and is supported in the new MyCap mobile app. For any projects currently using MyCap, there will be a “transition” button on the MyCap Participants page that will allow the users to transition the project and any existing participants to use the new MyCap mobile app (note: this transition process is completely optional and not required unless wanting to use longitudinal functionality and other new MyCap features). The older MyCap mobile apps will still be available and updated in the Apple App Store and Google Play Store for the time being. See our tutorial for greater details. |
13.10.0 |
| Function |
New special functions:
|
13.11.0 |
| Piping |
New piping parameters:
|
13.11.0 |
| Action Tags |
@SHOWCHOICE: When applied to a multiple-choice field, this action tag will hide all choices except for the ones listed in its argument. This action tag is useful if you wish to only show a subset of choices depending on some logic (e.g., depending on data access groups) via the IF action tag. The format must follow the pattern @SHOWCHOICE='??', in which the coded values should be inside single or double quotes for the choice(s) you wish to show. If more than one choice needs to be shown, then provide all the coded values separated by commas. For example, to show the choice 'Monday (1)', you would have @SHOWCHOICE='1', but if you wanted to additionally show 'Tuesday (2)', you would have @SHOWCHOICE='1,2'. NOTE: The @SHOWCHOICE action tag supports piping into its argument - e.g., @SHOWCHOICE=”[my_checkbox:checked:value]”. |
14.0.0 |
REDCap 14.5.8 LTS
In the Online Designer when viewing the fields of a specific instrument, a yellow star is now displayed to the right of the variable name for identifier fields to denote to users which fields are identifiers.The most relevant changes are highlighted in red.
| Category | Description | Introduced |
|---|---|---|
| User Rights | New “Read Only” user privilege for the User Rights page: Users and roles can now be given “Read Only” access to the User Rights page, which will allow users to view the page but not be able to take any actions on the page. Note: If a user is in a Data Access Group while viewing the page, it is still the case that they can only view users from their own DAG on the page. | 14.1.0 |
| Projects | Project Dashboard Folders: Project Dashboards in a project can now be organized into folders. If a user has Project Setup & Design privileges, they will see an "Organize" link on the left-hand project menu above the Project Dashboards panel. They will be able to create folders and then assign their Project Dashboards to a folder, after which the Project Dashboards will be displayed in collapsible groups on the left-hand menu. | 14.2.0 |
| Alerts & Notifications |
New “Test Run” option when re-evaluating Alerts and Automated Survey Invitations: When performing the “Re-evaluate” feature for Alerts and ASIs, a new toggle that says “Enable Test Run?” can be clicked in the dialog, which will perform a test run (dry run) to simulate what would have happened (e.g., schedule or send alerts/invitations) but without actually doing anything. This will allow users to feel more confident if they actually need to perform a real re-evaluation of Alerts or ASIs so that they know beforehand how many records will be affected during the re-evaluation. In addition, users may download a CSV file of all affected record names afterward, whether using the test run option or not. |
14.2.0 |
| Functions | Users may now use "now" or "today" (wrapped in quotes) instead of a field variable in the special functions day(), month(), and year() in order to capture a specific date component of today’s date. | 14.2.2 |
| Action Tags/MyCap | New action tags: @MC-PARTICIPANT-JOINDATE-UTC and @MC-PARTICIPANT-TIMEZONE: These action tags will capture the MyCap participant’s timezone and also the install date/time (in UTC time) of the MyCap participant whenever the participant joins a project via the MyCap mobile app. NOTE: This is used only for the MyCap mobile app. The fields’ values are not generated when viewing the data entry form but only when the MyCap app is making a call to REDCap when the participant joins the project. Additionally, while these action tags can be added to a new field in already-existing MyCap projects, a field with this action tag will be auto-added to any projects where MyCap is enabled in the project after the fact and for any new projects created using the MyCap project template. | 14.3.0 |
| Field Embedding | In the Online Designer, when a user clicks on the green button “Field is embedded elsewhere on this page” on an embedded field in the table, the page will scroll up to where the field is embedded and flash a red border around the container field. This will make it easier for users to find where a field is embedded. |
14.3.0 |
| MyCap |
MyCap now supports repeating instrument functionality for longitudinal projects. In previous versions, repeating instruments were only supported for class/non-longitudinal projects. |
14.3.1 |
| Fields | The rich text editor used throughout REDCap now has a new drop-down option in the editor's toolbar for setting the "font family" and "font size" of any text in the editor.
|
14.3.5 |
| Help | The video "Full Project Build" was added as a new video on the project left-hand menu and on the Training Videos page.
|
14.3.7 |
| MyCap | Mobile Toolbox measures have been added for use in the MyCap mobile app. The Mobile Toolbox (MTB) is a research platform that includes a library of cognitive and other tests that can be administered remotely on a smartphone. The MTB's measures include smartphone versions of assessments from the NIH Toolbox, the International Cognitive Ability Resource, and the Patient Reported Outcomes Measurement Information System. A list of all available MTB tasks in REDCap can be viewed via the “Import Active Task” button in the Online Designer for any MyCap-enabled project.
|
14.3.8 |
| Fields | In the Online Designer when viewing the fields of a specific instrument, a yellow star is now displayed to the right of the variable name for identifier fields to denote to users which fields are identifiers.
|
14.3.10 |
| MyCap | In a MyCap-enabled project, all MyCap tasks can now be manually set as Active or Not Active at any time on the MyCap settings page in the Online Designer. Setting a MyCap task as “not active” will prevent the task from appearing in the MyCap mobile app for participants. Note: The previous release enabled this feature specifically for MyCap active tasks, while this change makes this feature available to all MyCap tasks (not just active tasks).
|
14.3.11 |
| Fields | In the Online Designer when Ctrl-clicking multiple checkbox or radio fields to display the “Modify multiple fields” options, a new option to “Convert to matrix group” will appear, thus allowing users to merge the selected fields into a matrix. When merging fields into a matrix, the confirmation dialog will note that only the choices for the first field selected will be preserved (in case the selected fields have different choices). Additionally, the action will remove all field notes from the fields and will also remove all section headers (except for the first field's section header, if it exists).
In the Online Designer when editing a matrix of fields, a new button will appear at the bottom left of the “Edit Matrix of Fields” dialog that says “Save & split matrix into separate fields”. When clicked, it will convert the matrix into separate fields. |
14.3.13 |
| API | Background Data Import option for the API: Similar to using the Background Data Import on the Data Import Tool page, users may now utilize the feature when making a call to the Import Records API method. They can simply pass the API parameter “backgroundProcess” with a value of 1 (for Yes) or 0 (for No, which is the default) to invoke this option. The API will return a “success” message with “true” or “false” regarding if the data was successfully accepted. Note: This option works with any data format: CSV, JSON, or XML.
|
14.4.0 |
| User Rights | The Email Logging page now has its own separate user privilege. Previously, only users with "User Rights" privileges could access the Email Logging page. Now, users must explicitly be given "Email Logging" privileges in order to access the Email Logging page. Note: During the upgrade to REDCap 14.4.0 or higher, any users with "User Rights" privileges will automatically be given "Email Logging" privileges in order to keep continuity with their current access to the Email Logging page.
|
14.4.0 |
| E-Consent | Enhanced e-Consent Framework and PDF Snapshot Functionality:
|
14.5.0 |
| MLM/MyCap | Multi-Language Management can now be utilized by MyCap. Users will see a new “MyCap” tab on the MLM setup page, which will allow them to translate their custom MyCap elements that will appear to participants in the MyCap Mobile App. Participants will be given the choice to use any of the project’s MLM languages after opening and viewing the MyCap Mobile App.
|
14.5.4 |
| MyCap | When using MyCap in a project, users can now customize the notification time (default 8:00AM) for MyCap notifications to participants using the MyCap mobile app.
|
14.5.4 |
| Records | Bulk Record Delete:
|
14.6.0 |
REDCap 15.0.9 LTS
The most relevant changes are highlighted in red.
| Category | Description | Introduced |
|---|---|---|
| MLM/MyCap | Multi-Language Management can now be utilized by MyCap. Users will see a new “MyCap” tab on the MLM setup page, which will allow them to translate their custom MyCap elements that will appear to participants in the MyCap Mobile App. Participants will be given the choice to use any of the project’s MLM languages after opening and viewing the MyCap Mobile App. | 14.5.4 |
| Records | NEW FEATURE: Bulk Record Delete which enables to remove multiple records at the same time. | 14.6.0 |
| MyCap |
For MyCap projects that are longitudinal with multiple arms, users may now designate a Baseline Date Field for every arm on the baseline date setup popup in the Online Designer |
14.6.9 |
| Instruments | A new PDF download button has been added to the instrument-view of the Online Designer to allow users to download all instruments as a single PDF | 14.6.11 |
| Randomization |
NEW FEATURE: Randomization enhancements. A) Multiple randomizations in a project - Users may now define more than one randomization model in a single project. Each randomization model has its own settings (e.g., strata, randomization field, allocation table), and is completely independent of the other models. B) Blinded randomization support - Users may now create a randomization model that is blinded/concealed as a means of concealing the allocation (randomization value) from users to be able to have a truly blinded randomized clinical trial, for example. Users may still choose to create an "open" randomization model (as they always could) by choosing a single-select multiple choice field (e.g., drop-down or radio) to be the randomization field. Alternatively, users may now choose any text field [that does not have field validation] to represent the "randomization number". The randomization number can be uploaded as part of the allocation table, and when a record is then randomized, the field is given the randomization number as its value. C) New "Randomize Record" API method - This method allows an API user to randomize a record using the API. The API parameters required are content="record", action="randomize", record=Record name of record to randomize, and randomization_id=The unique id of the randomization (viewable on the Randomization page for users with Design permissions or on the API Playground page), which corresponds to a specific target field and event. This API method returns the value for the target randomization field (plus optionally the alternative target value), or an error message on failure (such as if the record does not exist or if stratification information is missing) D) Real-Time Trigger Logic
|
14.7.0 |
| Piping | Users may now pipe the field label of a given field (instead of its data value) by appending ":field-label" to the variable name inside the square brackets. | 14.7.2 |
| Help |
The "Online Designer" video on the Training Videos page was updated, and a new video "Randomization" was added. |
14.7.4 |
| Fields | NEW FEATURE: Descriptive Popups Descriptive popups are custom popups of text that become visible after hovering over a specific word or phrase on a data entry form or survey. They have two main components: 1) the link text, which should match a word or phrase used on a form or survey, and 2) the custom text for the popup content. Users may set a descriptive popup to work on all instruments/surveys (default) or on specific ones. Descriptive popups are a great way to convey extra information on a form or survey without the text taking up space on the page. Users may configure their descriptive popups to be activated only on specific instruments. By default, they are enabled on all instruments. Additionally, if the popups are enabled to work on a survey, especially a multi-page survey, users can specify specific page numbers on which the popups will be activated. |
14.8.0 |
| Draft changes | NEW FEATURE: Draft Preview Mode
|
14.8.0 |
| Confidentiality | A cookie policy was added that specifies the details of how cookies are utilized by a person's web browser when using REDCap. A link to the policy exists at the bottom of every webpage in REDCap. | 14.9.0 |
| Data dictionary | The user interface of the "Data Dictionary" page in a project has been simplified and improved to help users better understand the general process of editing and uploading a data dictionary. Additionally, buttons have replaced the links for downloading the data dictionary for improved web accessibility and for a better user experience. | 15.0.1 |
| MLM | When using Multi-Language Management, it is now possible to preset the language for a participant's Survey Queue by supplying the URL parameter "__lang", which must be set to a valid (active) language id (and is case-sensitive). Example: [survey-queue-url]&__lang=es. | 15.0.1 |
REDCap 15.5.8 LTS
The most relevant changes are highlighted in red.
| Category | Description | Introduced |
|---|---|---|
| Fields |
NEW ACTION TAGS: @SAVE-PROMPT-EXEMPT - This action tag is useful for preventing the "Save your changes?" warning prompt under certain conditions when navigating away from a data entry form or survey page. Adding this to a field will prevent any changes to the field's value from individually triggering the "Save your changes?" prompt when someone navigates away from the page without clicking the Save button. Please note that when using this action tag, if another field's value is also modified on the page, the "Save your changes?" prompt will be displayed to the user because this action tag only affects the individual field's ability to trigger the warning prompt. @SAVE-PROMPT-EXEMPT-WHEN-AUTOSET - This action tag is similar to the @SAVE-PROMPT-EXEMPT action tag, but its effect is limited to the initial setting of a field's value when the value is blank at the time the form/survey page is loaded. Use this action tag to prevent action tags such as @DEFAULT, @SETVALUE, @TODAY, or @NOW from triggering the "Save your changes?" prompt when someone navigates away from the page without clicking the Save button. |
15.2.0 |
| Instruments | For longitudinal projects with repeating events, Form Display Logic (FDL) can now be utilized within a specific repeating event. For example, if the FDL references a field inside a repeating event, that field can be used to reference a value in a specific repeating instance of the event, including the current instance (e.g., keep form X enabled if [field][previous-instance] = "1" or [field2][current-instance] > 30). This provides more flexibility so that forms within individual instances of a repeating event can be enabled/disabled via FDL at the instance level. In previous versions, FDL could not work at the instance level but merely applied the FDL to all repeating instances of a given repeating event as a whole. Note: This improvement only applies to repeating events and not to repeating instruments. | 15.3.2 |
| Alerts & Notifications |
NEW FEATURE: Pause Recurring Alerts setting - For alerts that are triggered by conditional logic, in which the alert has the "Ensure logic is still true..." checkbox checked, users can now utilize a new checkbox option titled "Allow pausing of recurrences? (Existing interval will continue if the logic becomes true again after becoming false.)". This setting is optional for Alerts & Notifications. When enabled together with the 'Ensure logic is still true...' setting, REDCap will pause (instead of deleting) any already-scheduled recurrences of this alert when the alert's logic becomes false. This is useful if you expect the logic to become true again in the future. This may be the case specifically with time-based logic, such as datediff(). |
15.4.0 |
| MyCap | MyCap-enabled projects are now able to receive data for Signature type fields from the MyCap mobile app. In previous versions, Signature fields could not be used in the MyCap app. | 15.4.1 |
| MyCap | When using MyCap, there now exists support for latitude and longitude fields (via action tags @latitude and @longitude) inside MyCap tasks when participants open a task in the MyCap app. | 15.4.5 |
| Survey |
NEW FEATURE: Custom CSS styling for individual forms and surveys
|
15.5.0 |
| Records |
NEW FEATURE: Record limit for development projects
|
15.5.0 |
UniFR Template and Best Practices
UNIFR Template
When requesting the creation of a project to REDCap admins (DIT-SIT, UNIFR), you project will be pre-populated with our own template (courtesy from CTU Bern)
Instruments
In this template we provide example eCRFs (instruments) for standard clinical trials forms:
- Eligibility
- Randomization
- End of Study
- (Serious) Adverse Event (study and sponsor) [specific to IMP trials]
- Protocol Deviation
User roles
| ROLE | DESCRIPTION |
|---|---|
| Analysis | Standard role for the statistician |
| Data Entry | Standard role for the study nurse |
| Monitoring | Standard role for central data monitoring and for on-site monitoring |
| Super User | The project super user has the maximum rights on his study database. He can manage user rights, roles, data access groups (DAGs), he can deploy his study database. |
| Project Setup | Design study database: create eCRFs (instruments), visit plan, reports, enter test data |
| Sponsor/PI | Standard role for the sponsor and/or the PI |
Reports
The template comes with a predefined report that you can use to submit (serious) adverse event cases to the ethics comittee: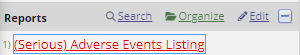
You can adapt the report to your study by going to
 and by clicking on "Edit":
Best Practices for Database Implementation
To improve the quality of your database implementation and make your statistician(s) happy, here are a few tips with courtesy from the CTU Bern.
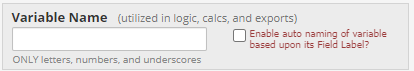
1. Provide understandable variable names
For each new item, you need to provide a unique variable name. Best practice is to include acronyms in the name of the item corresponding to:
- The instrument in which the item is located
- The label of the item
- The field type
For example, if you want to create an item in a "demographic" instrument assessing whether a participant is a UNIFR student, you could code it accordingly:
dem_unistud_yn
You will find below a list of acronyms that may be used to indicate the field type of an item:
| Field type | Acronym |
|---|---|
| Yes/No | _yn |
| True/False | _tf |
| Date | _dt |
| Date-time | -dtm |
| Integer | _int |
| Numeric | _num |
| Calculated fields | _calc |
| Descriptive text | _desc |
| Notes Box | _txt |
| File upload | _up |
! Be careful that the length of a variable name SHOULD NEVER EXCEED 26 characters !
2. Standardize the coding values
When creating an item and defining choices, try to be consistent across the entire database. You can, for example, use the following coding structure for special values:
| Code | Value |
|---|---|
| 0 | no/false/negative/absent/abnormal |
| 1 | yes/true/positive/present/normal |
| 1 | male |
| 2 | female |
| 88 | other/else |
| 99 | not available/NA/unknown |
Branching Logic Reminder
Here is a small reminder of the most useful fonctions in branching logic and what they can be used for:| Function | Description |
|---|---|
| [sex] = "2" | Display question if sex = female (Female is coded as 2) |
| [sex]= "2" and [given_birth] = "1" | Display question if sex = female (Female is coded as 2) and given birth = yes (Yes is coded as 1) |
| ([height] >= 170 or [weight] < 65) and [sex] = "1" | Display question if (height is greater than or equal to 170 OR weight is lower than 65) AND sex = male (Male is coded as 1) |
| [last_name] <> "" | Display question if last name is not blank (i.e., if last name field has data) |
| [visit_date] = "" | Display question if visit date is blank (i.e., if visit date has no data) |
| [race] = "88" | Display question if race = other (Other coded as 88) |
| [race(88)] = "1" | Display question if 'other race' is checked (Checkbox field type!) |
Multi-Language Management
The Multi-Language Management (MLM) feature enables you to setup translations for your fields as well as for the whole REDCap interface (e.g., buttons, links, instructions, ..).
Keep in mind, that you should ideally start defining new languages and translations only when your instruments' fields are all set and finalized.
IMPORTANT: Changes are not automatically saved, thus you regularly need to save your changes either by pressing on CTRL+S or on  .
.
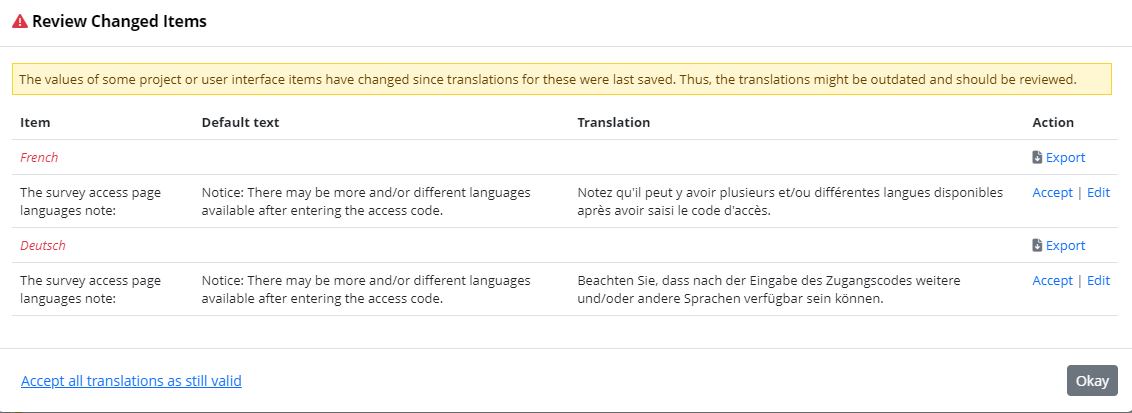
You are also informed of any updates to your original translated items:

And you are able to review the changes before approving them:
1. Add a New Language
To add a new language go to  ➡️
➡️  .
.
From there you have the possibility to either define the language manually or to use one of the system languages provided by the DIT-SIT team.
Of note, the first language should be the default one (i.e., the language in which your fields were originally written).
NEW INTERFACE (since REDCap 13.7.4)
When you want to add a new language, you first have to chose whether you want to use one of our validated system languages or if you prefer to build you translation from scratch: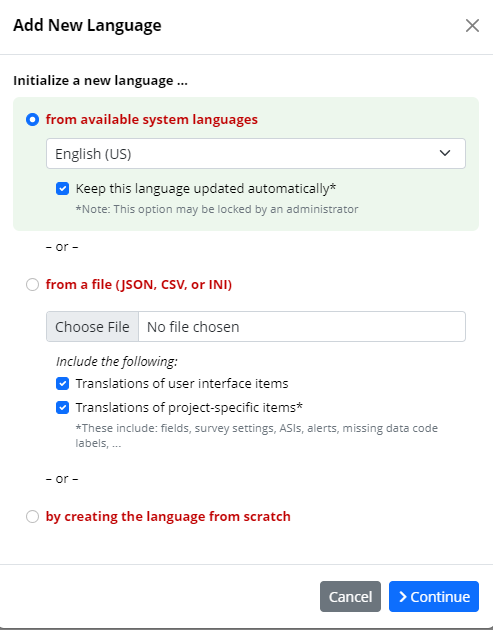
If you select the option "from available system languages" you now also have the possibility to keep the language updated automatically (i.e., the updates are done by REDCap admins).
1.1. System Languages
The DIT-SIT provides a number of system languages most of which were validated from the Johns Hopkins University.
You can find the list of available system languages as well as translation certification documents on the following REDCap webpage.
Keep in mind that these translations only apply to the User Interface but will not automatically translate your fields.
Click on  and then simply select the language from the drop-down list of "available system languages":
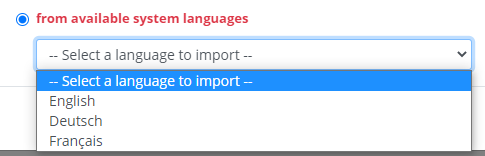
If the language you are interested in is not available in this list, email the DIT-SIT team and they will add the missing language(s) system translation.
1.2. Manually Setting Up a Language
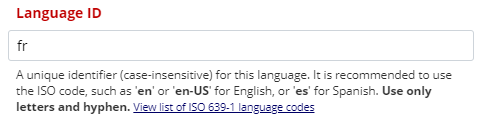
- First, you need to enter the 2-letters ISO code (see list) related to the language you want to define:
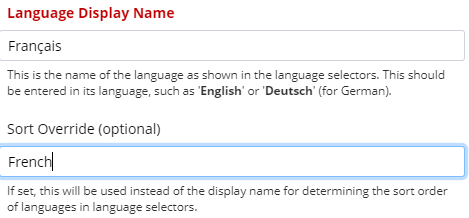
- Then, you should set the "Display Name" (in its language) and optionally define an "Alternate Name" (e.g., in English) to enhance classification :
When you are ready, simply press on to validate your settings.
2. General Settings
Once you have defined each language separately, they will appear under the  tab:
tab:
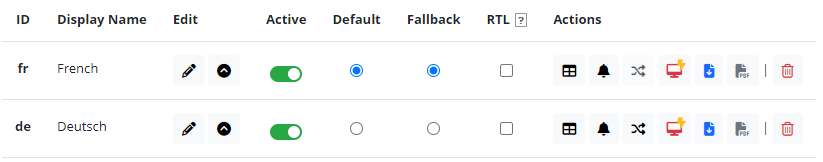
If you want to use one of the listed languages, do not forget to activate your languages  .
.
Again, you should always set the language in which you entered your fields (here French) as the "Default" and "Fallback" option (!).
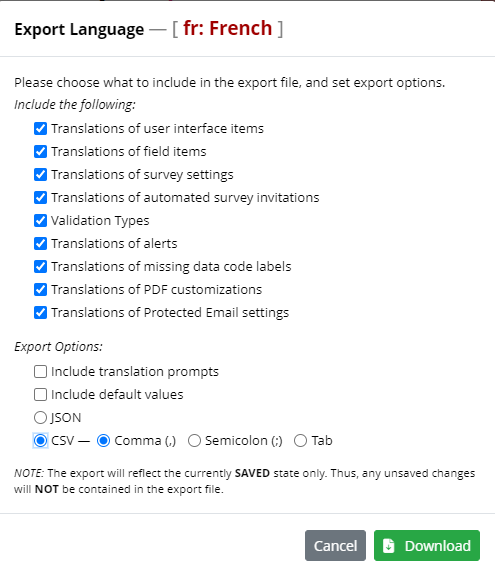
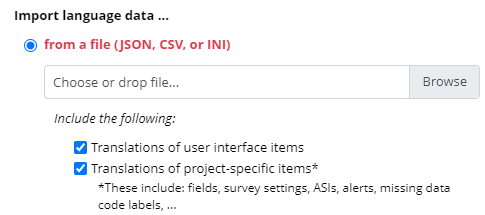
2.1. Import/Export Language Translations
You also have the possibility to export your language translations in different formats by pressing on  if you prefer to work in external applications (e.g., Excel):
Similarly, you can import your translations by editing a specific language: ➡️
➡️ 
and load your file here:
3. Forms/Survey
Under the 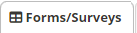 tab, first, select the language for which you'd like to manually enter translations (logically NOT the default/reference language):
  .
.
Then, for each instrument you have created you can define if you want to apply translations to the Data Entry and/or Survey functionality: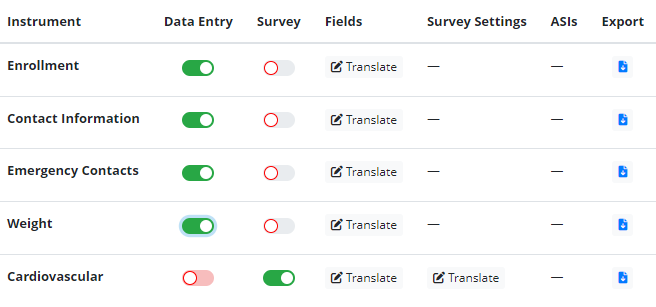
Once you are safistied with your settings, simply press on  to start providing translations to your fields.
Keep in mind here that you also have the possiblity to export individual instrument translations (similarly to what was described above for the whole language export/import).
4. Translate Items
The principle behing translating items remains the same if it's for fields, Alerts, or for the User Interface:
You need to manually enter the translation in the dedicated entry form for each item: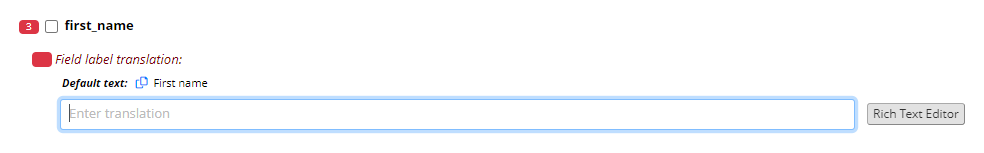
Once done, the field turns green: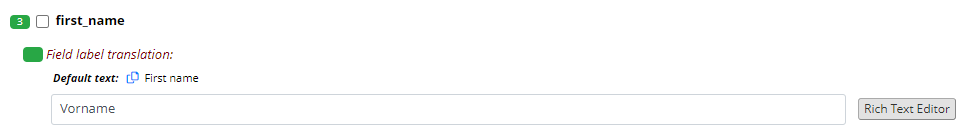
Repeat this step for all listed items and do not forget to save (CTLR + S or by pressing on )
)
If you have a very long list of items which are partially translated, you can always decide to hide the translated items by clicking on  .
.
If you chose to add a new language from the available system languages (see 1.2), you will notice that most (if not all) items under the  tab are already translated, e.g.:
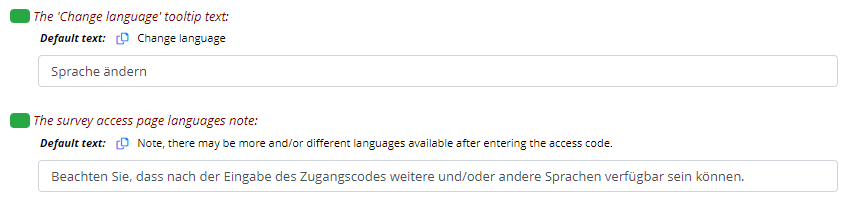
5. Advanced Settings
Under the  tab, you will find additional options that may, for e.g., help you identify missing translations.
There, you can also create snapshots of your translations by pressing on  .
.
As specified, creating a snapshot can be useful to allow you to revert your translations back to a specific point in time.
6. Language Preference Field
If you use Surveys, you have the possibility to create a field dedicated to setting language preferences for each record.
You have the possibility either to create the field for the Data Entry interface or for it to be displayed in the Survey.
- Select one your instrument and create a new field
 with type
  or
or  .
. - Give it a meaningful name (e.g., "language_pref")
- Define the choices according to the languages you have created earlier, e.g.:

Of note, the choices must match the languages ID (2-letters ISO CODE) you have defined earlier in the  module.
- Add the following
 to apply the language preference to your instruments:
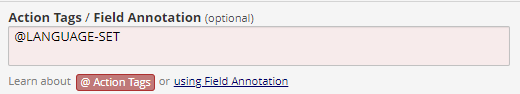
- Save the field, go back to
 and select the field you have just created from the drop-down list:
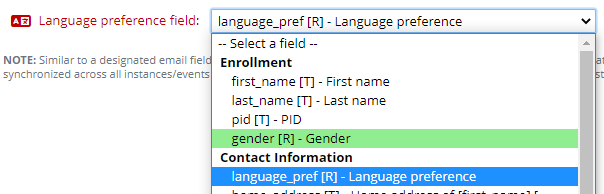
- Other can be used if, for e.g., if you want to retrieve the current language of a specific survey page and paste it somewhere else:
 .
.
Additional Documentation
Here are 4 videos that may support you in exploring the MLM module:
- Adding Languages
- Providing Translations of Surveys/Instruments
- Translating the User Interface
- Exporting and Importing Languages Between Projects
Calendar Sync
Since REDCap version 12.4.0 LTS, you now have the possibility to synch REDCap internal calendar with external applications such as Google Calendar, Outlook, Office 365, Zoho, Apple Calendar, or any application that supports iCal or ICS files.
1. Configure the Calendar
For that purpose go to  and click on
  .
.
At this point, you can either choose online or offline calendar synchronization. While online sychronization should be favoured because it will send regular updates to your external application, offline synchronization may also be handy in cases where you do not plan to make any adjustments to the REDCap calendar during the study trial.
1.1. Online Synchronization
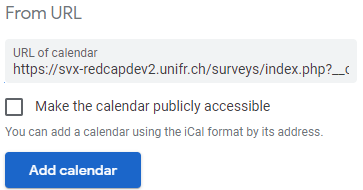
To use the  option, simply copy the calendar URL to the clipboard:

Then, open your favourite external calendar application (here Google Calendar) and import the new calendar "from URL":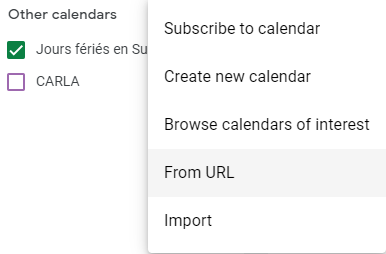
You then just need to paste the URL from the clipboard and the calendar will be successfully configured:
Of note, even though the REDCap calendar is not synchronized to your external application, this calendar feed represents a one-way feed. This means that while changes made to the calendar in REDCap will automatically show up in the external calendar application, you will not be able to modify them in the external calendar application because they will be read-only.
1.2. Offline Synchronization
If you prefer to use offline synchronization, you should follow the instructions under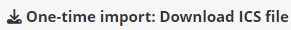 .
.Basically, click on
 and, in your external application (here Google Calendar), add a new calendar by "importing" a file:
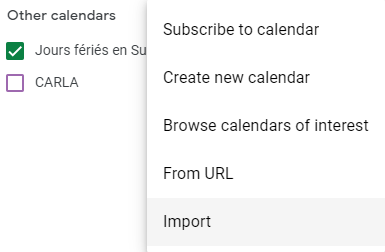
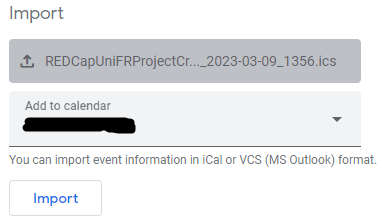
Select the *.ics file you just download and import it:
2. Longitudinal Designs
If your research project includes more than one visits, under you should enable the following functionality:
  .
.A new module appears right below which lets you configure the study's events grid:
1.1. Define Events Grid
First you need to define your study events by clicking on . When you have created your events, you need to
  .
.For more information on how to setup events and assign instruments to them, have a close look at this video:
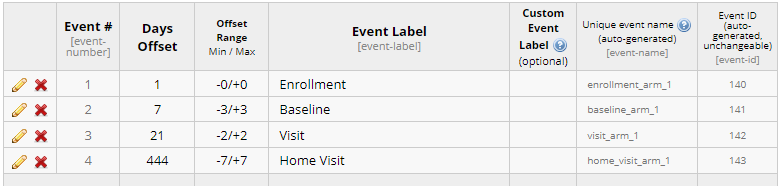
Here is a basic example of an event grid:
And the assignment of each instrument to their respective events:
1.2. Scheduling Module
Now that you have properly defined your events grid, go back to and enable the  .
.
A new option should now pop-up under the  sidebar:
 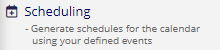 .
.
The scheduling module enables you to plan all the experimental sessions for a new or existing participants:
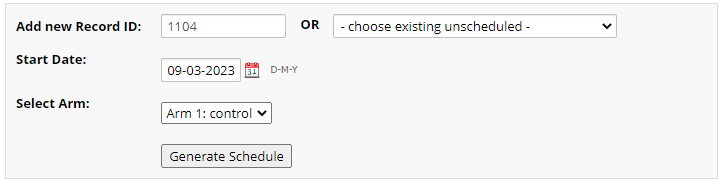
 and validate the request by pressing on
  your participant's schedule will be added to the REDCap Calendar.
If you now go back to the
, you will see that it's been automatically populated with the dates of your participants' sessions (here part. number 1104 and 1105), based on the events grid you defined earlier: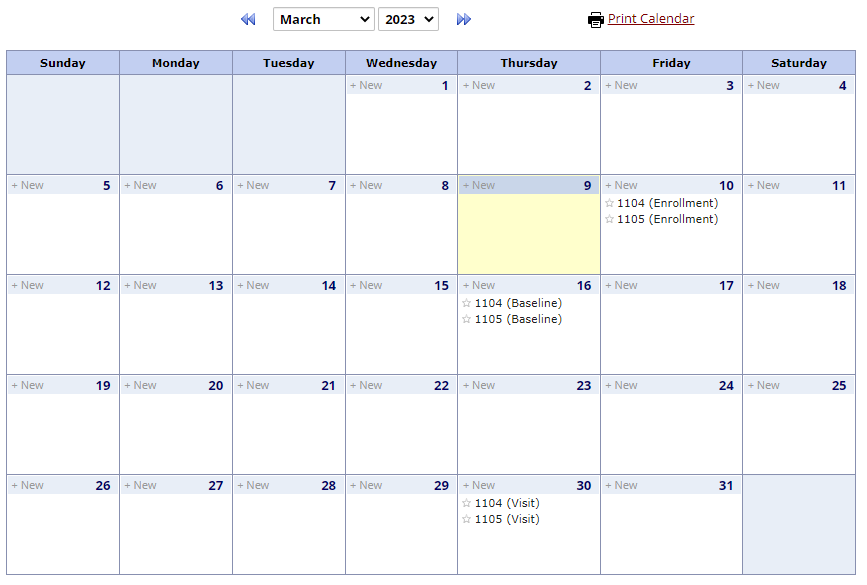
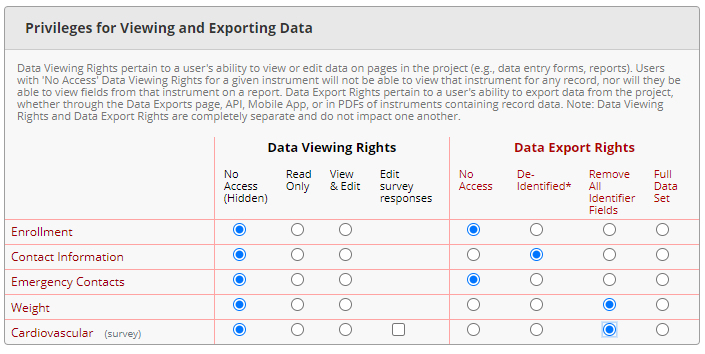
Instrument-level Data Export Rights
Before REDCap version 12.2.0 LTS, it was only possible to define a user's data export capabilities for all instruments at once:
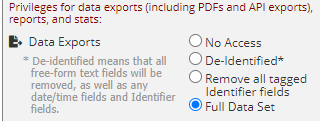
Now, you have the possibility to fine-tune the data export privileges for each instrument separately:
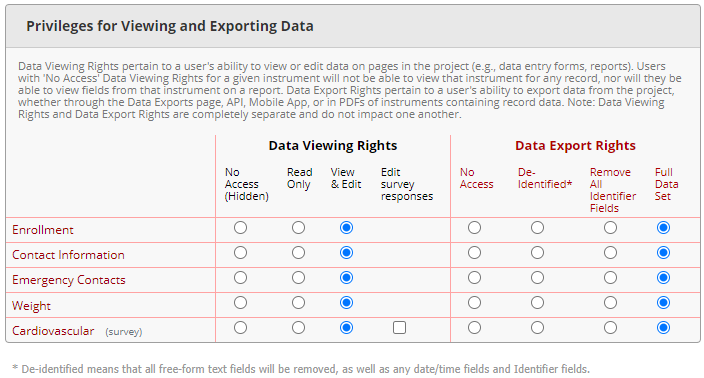
Thus, in the same way you used to defin Data Entry Rights for your instruments, you should now taken time to adjust the Export Rights depending on the role your research project's study personnel.
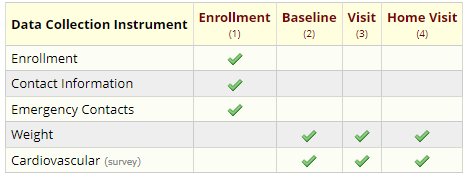
For example, if your study statitician should not be able to see identifying information from the "Contact Information" instrument and should only have access to the "Weight" and "Cardiovascular" data/survey, this is how the Data Viewing and Export Rights should be configured:
Standardized questionnaires
To speed up the implementation of your database, REDCap provides a large amount of standardized questionnaires that you can directly import as instruments in your project: list of available standardized questionnaires.
Importing a questionnaire
REDCap Consortium
Open your REDCap project, go to ![]() and then click on
and then click on ![]() to see the list of existing questionnaires.
to see the list of existing questionnaires.
Fof your information, Curated instruments highlighted with a star  have been approved for inclusion by the REDCap Library Oversight Committee (REDLOC) after review for research relevance, accuracy in function and coding (see guidelines), and copyright issues.
Once you have identified the questionnaire that you are looking for, simply click on its name and then on "Import into my REDCap project" :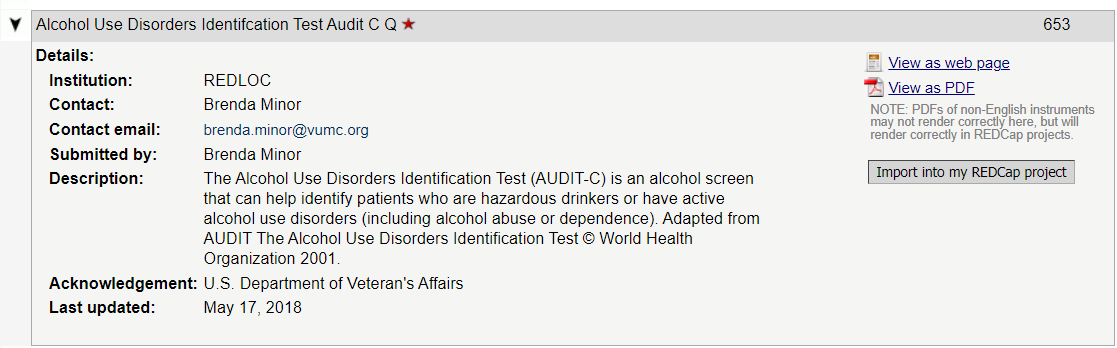
To import the questionnaire you will have to agree to the "Shared Content Agreement":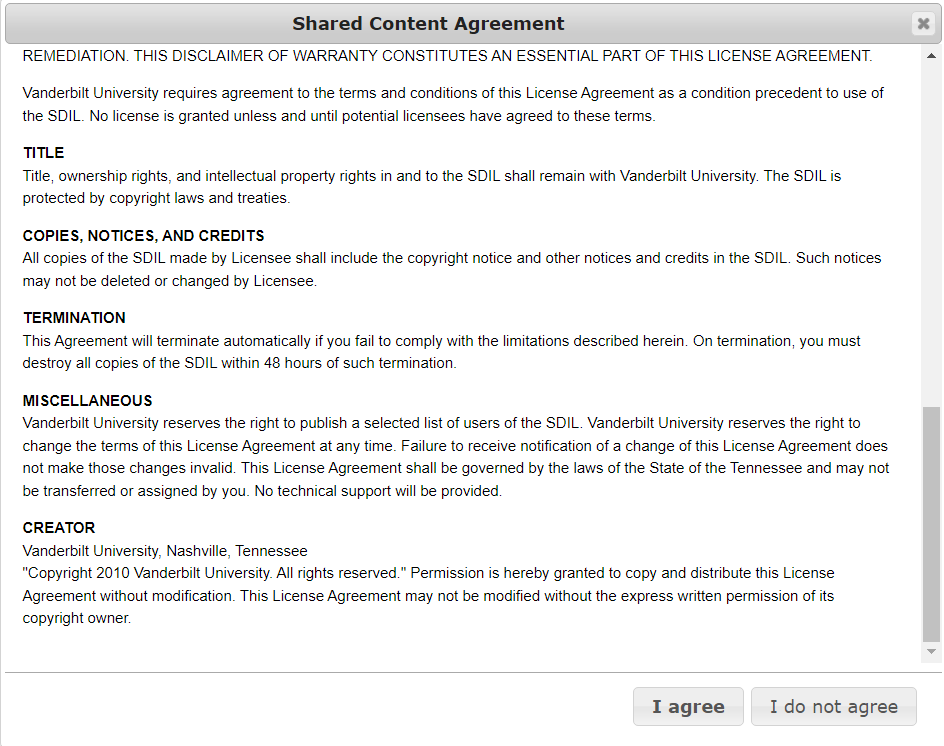
You can then define a custom instrumet name (or simply leave it as default):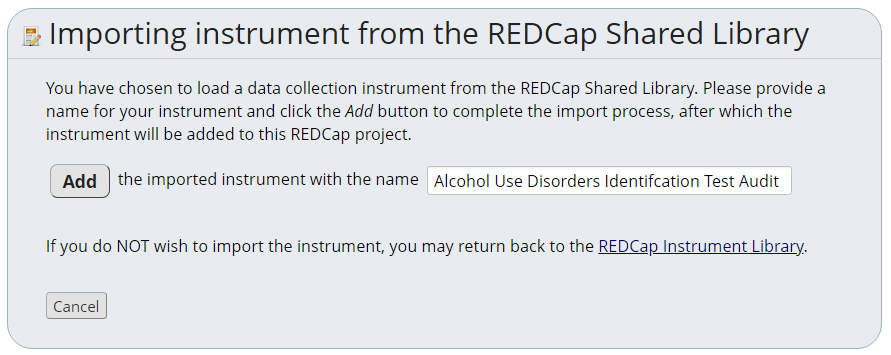
That's it, now the questionnaire is imported as the last instrument of your project:
![]()
Citation
If you download and utilize an instrument from the REDCap Shared Library, please cite the RSL manuscript accordingly:
Jihad S. Obeid, Catherine A. McGraw, Brenda L. Minor, José G. Conde, Robert Pawluk, Michael Lin, Janey Wang, Sean R. Banks, Sheree A. Hemphill, Rob Taylor, Paul A. Harris, Procurement of shared data instruments for Research Electronic Data Capture (REDCap), Journal of Biomedical Informatics, Available online 10 November 2012, ISSN 1532-0464, 10.1016/j.jbi.2012.10.006. (http://www.sciencedirect.com/science/article/pii/S1532046412001608)
External Providers
If you do not find what you are looking for, you can also have a look at one of the external libraries.
Still in ![]() , click on
, click on ![]() and then
and then ![]() to access their respective websites.
to access their respective websites.
Then you will have to download the instrument as .zip file and upload it in your project by clicking on ![]() (this same process can be applied if you want to upload an instrument from another REDCap project).
(this same process can be applied if you want to upload an instrument from another REDCap project).
Of note, make sure to follow the external libraries rules regarding citations and copyright.
Uploading a questionnaire
If your REDCap project is in production status, then you can also share any of your own data collection instruments that you have created by uploading individual instruments to the Shared Library, after which they will be accessible and downloadable by any REDCap user in the world.
For that purpose, once your instrument is developped and well validated, please fill in this form: https://redcap.vumc.org/surveys/?s=9MHM3RDYN7
Please note that the UniFR REDCap Team will not take part nor provide any support in this process.
Video Tutorials
MyCap
MyCap is a REDCap module as well as an iOS v11.0+/Android v8.0+ application whose purpose is to create user-friendly frameworks for survey creation, data collection and automated administration of active tasks (activities performed by participants using mobile device sensors under semi-controlled conditions).
NEWS:
- MyCap now also supports longitudinal projects (see changes from version 14.0.8) ! For more information, see .
- A new MyCap app
 was release in September 2023. You should now ignore the older app which was renamed MyCap Classic
 .
.
1. Configuring MyCap
Under "Project Setup", simply enable MyCap:  .
.
As soon as you enable MyCap, an instruction window opens up. Please read through it carefully (also summarized below).
You can always reopen the instructions by clicking on  .
.
1.1. Instructions summary
- To configure MyCap Tasks/Schedules a user must have "Project Design and Setup" rights (under
 ). To invite participants/send messages, the "Manage MyCap Participants" rights must be activated.
 - A record must already exist for a participant to join the project in the MyCap App (thus the first instrument containing the participant record cannot be used as a MyCap Task).
- By default, MyCap Tasks are scheduled based on the date participants join your project on their MyCap app.
- To enable an instrument go to
 and select the instruments which you would like to activate in MyCap:
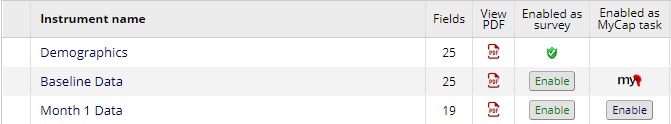
- For a better graphical experience, you can use "MyCap App Design":
 .
. - To setup communications with participants and investigate App synchronization issues , go to
 .
. - When you are done and/or anytime you make changes, you need to publish your new MyCap version:
 .
. - Extensively test your project on an Android (v8.0+) and iOS (v11.0+) devices or any device type (phones, tablets) that participants might use prior to onboarding participants.
Demonstrations
Vanderbilt University (USA) provides 3 examples using MyCap:
Additional information
- How to configure instruments to be MyCap Tasks
- How to create study-specific MyCap App pages for participants
- How to invite participants to join MyCap and manage communications
Project Dashboards
Project Dashboards are pages with dynamic content that can be added to a project. Dashboards can utilize special smart variables called Smart Functions, Smart Tables and Smart Charts that perform some basic aggregation of data in your project or display simple descriptive statistics or charts.
See an example of a public project dashboard.
1. Create a Project Dashboard
To create your first Project Dashboard, go to and then simply
  .
.1.1. Setup Wizard
The setup wizard helps you with creating a dashboard using the new smart variables. The wizard provides an intuitive editor allowing you to select the variables you are interested in and how to filter them. The wizard will output the syntax that you need to insert into the dashboard.
 Make sure to copy the generated Smart Variable syntax before you exit the wizard. You can then paste the information to display into the location on the Dashboard Content field that you want. You can use the wizard to help you set up any type of smart function, chart or table.
Of note, ...
- in order not to impact the overall performance of REDCap, project dashboards only check for updated data once every 10 minutes, hence data may be slightly out-of-date in dashboards. At the top right of a dashboard, there will be an indicator showing when the data was laste cached.
- project Dashboards and Smart Functions, Smart Charts and Smart Tables do not currently work in the REDCap Mobile App (for offline data collection)
1.2. User Rights
You are able to set user-specific rights to access a dashboard. You can choose either specific users or specific Data Access Groups (DAGs) who can view a specific dashboard. This is similar to the access you can set for specific reports.
1.3. Data Privacy
Smart Functions/Tables/Charts are intended to display aggregate data. However, if there are a small number of records for a particular filter, then displaying values in a scatterplot could represent a threat to an individual's privacy if the information is displayed on a public dashboard. For this reason, the minimum number of records required to display Smart Functions/Tables/Charts is 11. If a public dashboard is loaded when there are very few records for certain categories, then a message reading [INSUFFICIENT AMOUNT OF DATA FOR DISPLAY] will display instead.
1.4. Make the Dashboard Public
When you are editing a dashboard, there is a section at the top that allows you to set the dashboard as "public":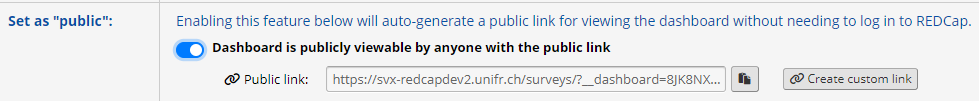
A public dashboard will have an automatically generated URL that you can copy and paste to share with others. You can also set a custom short link by pressing on
 .
.Of note, a public dashboard will not show up in search engine search results (e.g., Google, Bing, ...) (!).
2. Smart Functions, Tables & Charts
Smart Functions, Tables and Charts are new types of Smart Variables that can provide aggregate information across records.2.1. Smart Functions
Smart Functions are smart variables that evaluate data in a context-dependent way, but produce aggregate results. You can use Smart Functions to produce project-level aggregates (e.g. average and standard deviation for age of all participants) or to aggregate information within a record.
List of Aggregate Smart Functions:
- [aggregate-min:fields:parameters]: The minimum value of a field across all records in a project.
- [aggregate-max:fields:parameters]: The maximum value of a field across all records in a project.
- [aggregate-mean:fields:parameters]: The mean/average of a field across all records in a project.
- [aggregate-median:fields:parameters] The median value of a field across all records in a project.
- [aggregate-sum:fields:parameters]: The sum of all values for a field across all records in a project.
- [aggregate-count:fields:parameters]: The count of all values in a field across all records in a project.
- [aggregate-stdev:fields:parameters]: The standard deviation of a field across all records in a project.
- [aggregate-unique:fields:parameters]: The number of unique values in a field across all records in a project.
Multiple fields may be used in each Smart Function, which will aggregate the values across all values for all of the fields. (e.g. if you have two different "height" fields for participants in different arms of a study, then you could list both variable names to get the average of all participants.)
Smart Functions can be used in anywhere in a project where piping is permitted, including inside calculations, branching logic or report filters.
2.2. Smart Tables
Smart Tables are tables that automatically display aggregate descriptive statistics. A Smart Table will list the results of any or all of the following stats functions:

Smart Tables can be inserted with the Smart Variable [stats-table]. List the variables you would like to display as a parameter, separated by commas. (e.g. [stats-table: variable1, variable2] will display a table with variable1 and variable2 in separate rows.
Display Only Some Columns: By default, all columns are displayed in a Smart Table. If you would only like some columns displayed, then you can list them as a parameter using the following designations separated by commas: count, missing, unique, min, max, mean, median, stdev, sum. For example, [stats-table:field1,field2,field3:mean,max].
2.2. Smart Charts
Smart Charts allow you to display simple plots and charts utilizing aggregate Smart Function data. Smart Functions and Smart Charts do not have the power of statistical analysis or data visualization software. Smart Charts are most useful for simple categorical data.
- Colors are preset and are not modifiable.
- Accessibility: Smart Charts are automatically enabled with the option to switch to a color-blind friendly display.
- When to Use: Smart Charts can be used anywhere in a project where piping is allowed
- Click to Enlarge: When viewing a dashboard Smart Chart, it can always be enlarged by clicking on it.
Line Charts
| Description / Syntax | Chart Display |
|---|---|
|
Line Chart with Two Fields Smart Variable snytax for this chart: |
 |
|
Line Chart with a Third Variable for Grouping Smart Variable syntax for this chart: |
 |
Scatter Plots
| Description / Syntax | Chart Display |
|---|---|
|
Scatter Plot of Two Fields Smart Variable syntax for this chart: |
 |
|
Scatter Plot with a Third Variable for Grouping Smart Variable syntax for this chart: |
 |
Pie Charts
| Description / Syntax | Chart Display |
|---|---|
|
Pie Chart Smart Variable syntax for this chart: |
 |
Donut Charts
| Description / Syntax | Chart Display |
|---|---|
|
Donut Chart Smart Variable syntax for this chart: |
 |
Optional Parameters for Smart Functions, Smart Tables and Smart Charts
There are a number of optional parameters that can be used with Smart Functions/Tables/Charts:
- :R-XXXXXXXXXX Unique Report Name - For Aggregate Functions, Charts, and Tables, filter the data being used by appending a Unique Report Name. Next to each report on the 'My Reports & Exports' page is its unique report name, which has 'R-' following by alphanumeric characters. By default, all Aggregate Functions, Charts, and Tables will use the values of all records in the project, but if a unique report name is appended to any of them, only data from that specific report will be used. Using a report as a surrogate to filter data is a very useful technique of performing complex filtering logic for Aggregate Functions, Charts, and Tables.
- :record-name - For Aggregate Functions, Charts, and Tables, filter the data being used to the *current record* by using the literal value 'record-name'. Note: This parameter will only work in a context where a single record is being viewed/accessed, such as on a survey page, data entry form, etc. This parameter can be used with any of the other parameters except unique report names.
- :event-name - For Aggregate Functions, Charts, and Tables, filter the data being used to the *current event* (longitudinal projects only) by using the literal value 'event-name'. Note: This parameter will only work in a context where a single record/event is being viewed/accessed, such as on a survey page, data entry form, etc. This parameter can be used with any of the other parameters except unique report names.
- :unique-event-names Unique Event Names - For Aggregate Functions, Charts, and Tables, filter the data being used to specific events (longitudinal projects only) by providing an event's unique event name (found on the Define My Events page). You may use one or more unique event names (comma-separated). Note: This parameter can be used with any of the other parameters except unique report names.
- :user-dag-nameFor Aggregate Functions, Charts, and Tables, filter the data being used to the records assigned to the *current user's Data Access Group* by using the literal value 'user-dag-name'. Note: This parameter will only work in a context where an authenticated user belongs to a project and has been assigned to a DAG in the project (this excludes survey pages and public project dashboards). This parameter can be used with any of the other parameters except unique report names.
- :unique-dag-names Unique DAG Names - For Aggregate Functions, Charts, and Tables, filter the data being used to the records assigned to specific Data Access Groups by providing a DAG's unique group name (found on the Data Access Groups page). You may use one or more unique DAG names (comma-separated). Note: This parameter can be used with any of the other parameters except unique report names.
- :bar-vertical - Display a bar chart with the bars going vertically instead of horizontally (the default) by using the literal value 'bar-vertical'. Note: This parameter can be used with any of the other parameters.
- :bar-stacked - Only for bar charts using two fields, display the bar chart with the bars stacked on top of one another for each choice. Whereas the default view is that the bars of each field are displayed side by side to show the color grouping. To enable this, use the literal value 'bar-stacked'. Note: This parameter can be used with any of the other parameters.
- :no-export-link - Only for bar charts using two fields, display the bar chart with the bars stacked on top of one another for each choice. Whereas the default view is that the bars of each field are displayed side by side to show the color grouping. To enable this, use the literal value 'bar-stacked'. Note: This parameter can be used with any of the other parameters.
Source of the page content: https://kb.wisc.edu/smph/informatics/page.php?id=111590
Additional information
Twilio SMS messaging for REDCap
! The Twilio SMS feature is currently offered by the DIT-SIT as a 1-year test phase !
During this time period, the SIT team will evaluate whether Twilio is the most suitable method for handling SMS within REDCap.
Keep in mind that phone numbers are considered identifying information. Thus, it is mandatory to explicitly state in your ethics protocol that you plan on collecting phone numbers.
1. Request the Activation
Send the SIT team an email stating that you'd like to activate the SMS Twilio Module for your REDCap project.Please provide the following information:
- REDCap server (MED or SEC)
- Project name
- Estimated number of SMS/year
- Estimated duration of the study
Of note, only Swiss phone numbers are currently accepted.
2. Activate the Twilio Module (done by DIT-SIT)
On your REDcap project page, we will activate the Twilio Module by entering the credentials under:
 ➡️
➡️
3. Configure Twilio Module
To configure the Twilio Module go to
⬇️
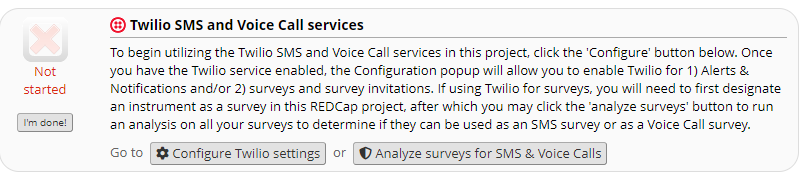
⬇️
From there, you can decide whether you want to active Twilio for Survey, Alerts or both:
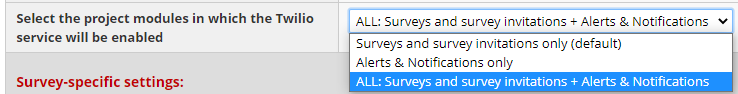
Here, we advise only to use the "Survey as webpage" option and to avoid using the voice call service (at least for the moment):
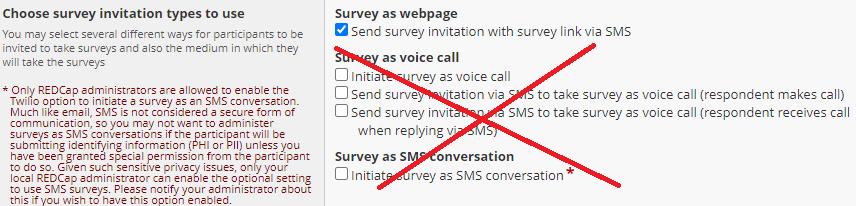
3.1 Survey Invitations
Requires that the survey module is activated ➡️  .
.
To specify the phone numbers of your survey respondents, follow these steps:
 ➡️
➡️  ➡️
➡️ 
Enter the list of phone numbers which should receive an invitation:
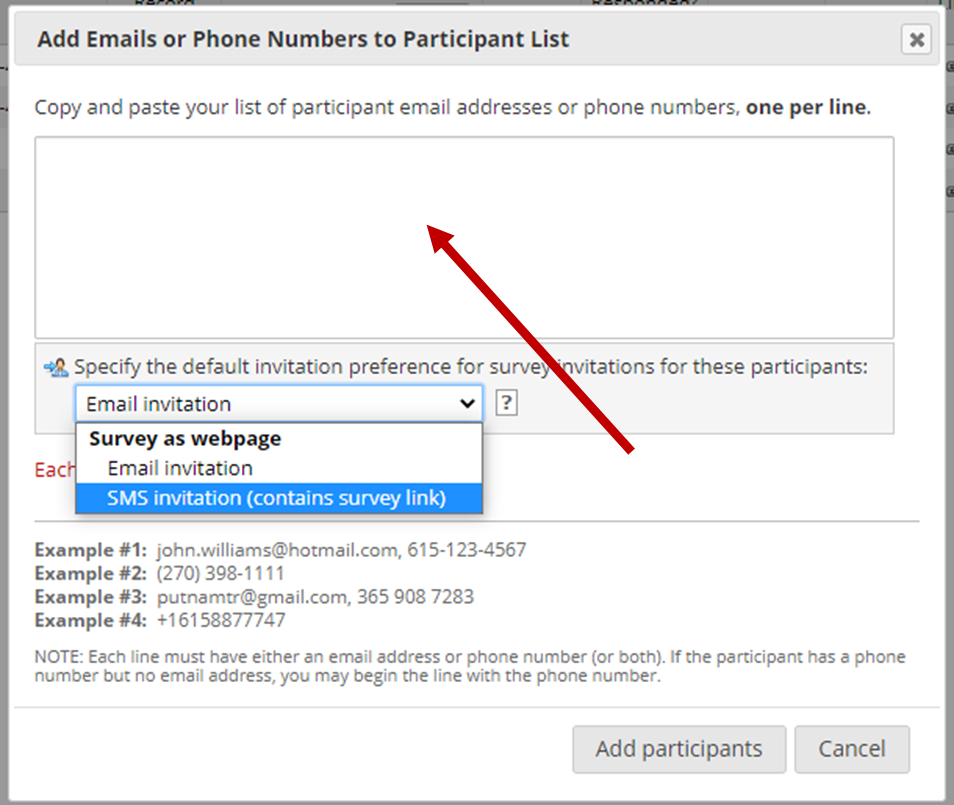
Finally, compose your invitation by clicking on  .
.
3.2 Alerts & Notifications
To setup the SMS functionality for alerts and notifications follow these steps: ➡️
➡️ 
Do not forget to change the Alert Type to "SMS Text Message":
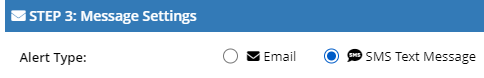
Again, you should avoid using the Voice Call functionality, at least for the moment:
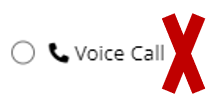
4. Overview of Messages Sent
If you want to have an overview of the Email/SMS sent within your project over time go to .
.5. Admin API Access to Your Project
For your information, an admin from the DIT-SIT tram will grant himself/herself API export rights to your project in order to record the amount of SMS that are being sent.
Of relevance, Identifying fields will be removed in the export rights for the admin user, such that only anonymized data is exported.
Randomization
Randomization can be directly implemented in REDCap and can sometimes be a bit tricky. We provide here suggestions to improve the quality of your randomization in REDCap.
1. Enable the Randomization Module
Go to  then click on "Enable"
  .
.
A new option will then pop-up under "Applications" (left hand menu):  .
.
2. Define the Randomization Model
Depending on the complexity of your research design, you have two optional settings that may be configured:
 : By choosing strata (multiple choice fields), you may then be able to ensure balance within subgroups such as gender, race, etc. You can add up to 14 stratification factors.
 : Stratify the randomization by each group/site in case of multi-center/multi-site project. A multiple choice field or the Data Access Groups can be chosen to stratify by group/site.
 where you define the field where the allocated randomization (treatment) group will be saved and stored (this is where the
  button wille appear). In the case of a longitudinal design (with or without multiple study arms), you also have to chose the event name where the button should appear.
| Of note, REDCap reaches its limits here in that it can only offer static randomization. Thus, for study designs including different study arms, REDCap does not offer the possibility to randomize your participants to either one of the other study arm. As such, you should think carefully whether you really need to create separate "arms" in your REDCap project. The purpose of REDCap's arm functionality is to facilitate different groups of records having different events or different form-event mappings. You do not necessarily need to set up separate REDCap arms just because your study has separate treatment arms. If you really need to randomize your participants to different study arms, then you could follow this example: When our studies use this type of 3-arm project, we train study teams in manually entering data for subject #1 in the randomization arm, then randomizing them, and then starting another record for subject #1 in the correct intervention or control arm. You'll get a warning from REDCap that 2 records in different arms have the same record ID, but in this example that is what you want. For this alternate method to work, you will need to deactivate the  (Know that deactivating this module entails risks for your study as you will be responsible for numbering your records ID). (Know that deactivating this module entails risks for your study as you will be responsible for numbering your records ID). |
|---|
Once you save your randomization model you should get the following message:

Also, be informed that once you save your randomization model:

3. Prepare and Upload Allocation Tables
Based on your randomization model, REDCap provides you with 3 different models (Excel .csv files with comma delimiter):
Take the one that suits you better and start defining your allocations randomly.
This step is usually performed by your study statistician, while the rest of the study team should remain blind to conditions allocation.
Most importantly, you should ALWAYS PREPARE TWO DIFFERENT ALLOCATION TABLES !
The allocation table for the DEVELOPMENT status should be different from the one used in PRODUCTION mode:
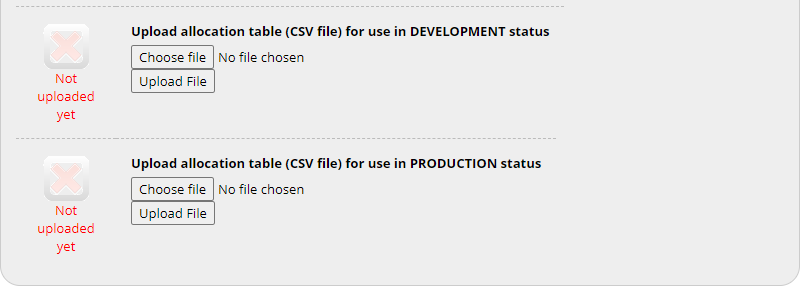
The development allocation table is used to perform pre-tests while the productive allocation table should solely be used once recruiting real participants' data.
Additional Documentation
For a step-by-step demonstration, have a quick look at the following video: