
REDCap tutorials
This book contains tutorials related to complex functionalities from REDCap as well as a list of new functionalities that are introduced at each major update.
Of note, if in REDCap you are not seeing one of the functionalities presented in the book, it means that you do not have the access rights. To access the desired functionality, go to  , select your username and click on
  to adjust the individual access privileges. If you are not even seeing the option, then you need to ask the project responsible or the Sponsor/PI to grant you access to the desired functionality.
Recording of the last REDCap Database Implementation Course [16.10.2025]
The course material can be downloaded here.
Project Dashboards
Project Dashboards are pages with dynamic content that can be added to a project. Dashboards can utilize special smart variables called Smart Functions, Smart Tables and Smart Charts that perform some basic aggregation of data in your project or display simple descriptive statistics or charts.
See an example of a public project dashboard.
1. Create a Project Dashboard
To create your first Project Dashboard, go to and then simply
  .
.1.1. Setup Wizard
The setup wizard helps you with creating a dashboard using the new smart variables. The wizard provides an intuitive editor allowing you to select the variables you are interested in and how to filter them. The wizard will output the syntax that you need to insert into the dashboard.
 Make sure to copy the generated Smart Variable syntax before you exit the wizard. You can then paste the information to display into the location on the Dashboard Content field that you want. You can use the wizard to help you set up any type of smart function, chart or table.
Of note, ...
- in order not to impact the overall performance of REDCap, project dashboards only check for updated data once every 10 minutes, hence data may be slightly out-of-date in dashboards. At the top right of a dashboard, there will be an indicator showing when the data was laste cached.
- project Dashboards and Smart Functions, Smart Charts and Smart Tables do not currently work in the REDCap Mobile App (for offline data collection)
1.2. User Rights
You are able to set user-specific rights to access a dashboard. You can choose either specific users or specific Data Access Groups (DAGs) who can view a specific dashboard. This is similar to the access you can set for specific reports.
1.3. Data Privacy
Smart Functions/Tables/Charts are intended to display aggregate data. However, if there are a small number of records for a particular filter, then displaying values in a scatterplot could represent a threat to an individual's privacy if the information is displayed on a public dashboard. For this reason, the minimum number of records required to display Smart Functions/Tables/Charts is 11. If a public dashboard is loaded when there are very few records for certain categories, then a message reading [INSUFFICIENT AMOUNT OF DATA FOR DISPLAY] will display instead.
1.4. Make the Dashboard Public
When you are editing a dashboard, there is a section at the top that allows you to set the dashboard as "public":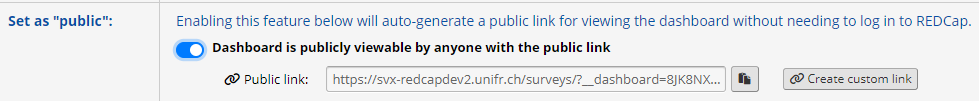
A public dashboard will have an automatically generated URL that you can copy and paste to share with others. You can also set a custom short link by pressing on
 .
.Of note, a public dashboard will not show up in search engine search results (e.g., Google, Bing, ...) (!).
2. Smart Functions, Tables & Charts
Smart Functions, Tables and Charts are new types of Smart Variables that can provide aggregate information across records.2.1. Smart Functions
Smart Functions are smart variables that evaluate data in a context-dependent way, but produce aggregate results. You can use Smart Functions to produce project-level aggregates (e.g. average and standard deviation for age of all participants) or to aggregate information within a record.
List of Aggregate Smart Functions:
- [aggregate-min:fields:parameters]: The minimum value of a field across all records in a project.
- [aggregate-max:fields:parameters]: The maximum value of a field across all records in a project.
- [aggregate-mean:fields:parameters]: The mean/average of a field across all records in a project.
- [aggregate-median:fields:parameters] The median value of a field across all records in a project.
- [aggregate-sum:fields:parameters]: The sum of all values for a field across all records in a project.
- [aggregate-count:fields:parameters]: The count of all values in a field across all records in a project.
- [aggregate-stdev:fields:parameters]: The standard deviation of a field across all records in a project.
- [aggregate-unique:fields:parameters]: The number of unique values in a field across all records in a project.
Multiple fields may be used in each Smart Function, which will aggregate the values across all values for all of the fields. (e.g. if you have two different "height" fields for participants in different arms of a study, then you could list both variable names to get the average of all participants.)
Smart Functions can be used in anywhere in a project where piping is permitted, including inside calculations, branching logic or report filters.
2.2. Smart Tables
Smart Tables are tables that automatically display aggregate descriptive statistics. A Smart Table will list the results of any or all of the following stats functions:

Smart Tables can be inserted with the Smart Variable [stats-table]. List the variables you would like to display as a parameter, separated by commas. (e.g. [stats-table: variable1, variable2] will display a table with variable1 and variable2 in separate rows.
Display Only Some Columns: By default, all columns are displayed in a Smart Table. If you would only like some columns displayed, then you can list them as a parameter using the following designations separated by commas: count, missing, unique, min, max, mean, median, stdev, sum. For example, [stats-table:field1,field2,field3:mean,max].
2.2. Smart Charts
Smart Charts allow you to display simple plots and charts utilizing aggregate Smart Function data. Smart Functions and Smart Charts do not have the power of statistical analysis or data visualization software. Smart Charts are most useful for simple categorical data.
- Colors are preset and are not modifiable.
- Accessibility: Smart Charts are automatically enabled with the option to switch to a color-blind friendly display.
- When to Use: Smart Charts can be used anywhere in a project where piping is allowed
- Click to Enlarge: When viewing a dashboard Smart Chart, it can always be enlarged by clicking on it.
Line Charts
| Description / Syntax | Chart Display |
|---|---|
|
Line Chart with Two Fields Smart Variable snytax for this chart: |
 |
|
Line Chart with a Third Variable for Grouping Smart Variable syntax for this chart: |
 |
Scatter Plots
| Description / Syntax | Chart Display |
|---|---|
|
Scatter Plot of Two Fields Smart Variable syntax for this chart: |
 |
|
Scatter Plot with a Third Variable for Grouping Smart Variable syntax for this chart: |
 |
Pie Charts
| Description / Syntax | Chart Display |
|---|---|
|
Pie Chart Smart Variable syntax for this chart: |
 |
Donut Charts
| Description / Syntax | Chart Display |
|---|---|
|
Donut Chart Smart Variable syntax for this chart: |
 |
Optional Parameters for Smart Functions, Smart Tables and Smart Charts
There are a number of optional parameters that can be used with Smart Functions/Tables/Charts:
- :R-XXXXXXXXXX Unique Report Name - For Aggregate Functions, Charts, and Tables, filter the data being used by appending a Unique Report Name. Next to each report on the 'My Reports & Exports' page is its unique report name, which has 'R-' following by alphanumeric characters. By default, all Aggregate Functions, Charts, and Tables will use the values of all records in the project, but if a unique report name is appended to any of them, only data from that specific report will be used. Using a report as a surrogate to filter data is a very useful technique of performing complex filtering logic for Aggregate Functions, Charts, and Tables.
- :record-name - For Aggregate Functions, Charts, and Tables, filter the data being used to the *current record* by using the literal value 'record-name'. Note: This parameter will only work in a context where a single record is being viewed/accessed, such as on a survey page, data entry form, etc. This parameter can be used with any of the other parameters except unique report names.
- :event-name - For Aggregate Functions, Charts, and Tables, filter the data being used to the *current event* (longitudinal projects only) by using the literal value 'event-name'. Note: This parameter will only work in a context where a single record/event is being viewed/accessed, such as on a survey page, data entry form, etc. This parameter can be used with any of the other parameters except unique report names.
- :unique-event-names Unique Event Names - For Aggregate Functions, Charts, and Tables, filter the data being used to specific events (longitudinal projects only) by providing an event's unique event name (found on the Define My Events page). You may use one or more unique event names (comma-separated). Note: This parameter can be used with any of the other parameters except unique report names.
- :user-dag-nameFor Aggregate Functions, Charts, and Tables, filter the data being used to the records assigned to the *current user's Data Access Group* by using the literal value 'user-dag-name'. Note: This parameter will only work in a context where an authenticated user belongs to a project and has been assigned to a DAG in the project (this excludes survey pages and public project dashboards). This parameter can be used with any of the other parameters except unique report names.
- :unique-dag-names Unique DAG Names - For Aggregate Functions, Charts, and Tables, filter the data being used to the records assigned to specific Data Access Groups by providing a DAG's unique group name (found on the Data Access Groups page). You may use one or more unique DAG names (comma-separated). Note: This parameter can be used with any of the other parameters except unique report names.
- :bar-vertical - Display a bar chart with the bars going vertically instead of horizontally (the default) by using the literal value 'bar-vertical'. Note: This parameter can be used with any of the other parameters.
- :bar-stacked - Only for bar charts using two fields, display the bar chart with the bars stacked on top of one another for each choice. Whereas the default view is that the bars of each field are displayed side by side to show the color grouping. To enable this, use the literal value 'bar-stacked'. Note: This parameter can be used with any of the other parameters.
- :no-export-link - Only for bar charts using two fields, display the bar chart with the bars stacked on top of one another for each choice. Whereas the default view is that the bars of each field are displayed side by side to show the color grouping. To enable this, use the literal value 'bar-stacked'. Note: This parameter can be used with any of the other parameters.
Source of the page content: https://kb.wisc.edu/smph/informatics/page.php?id=111590